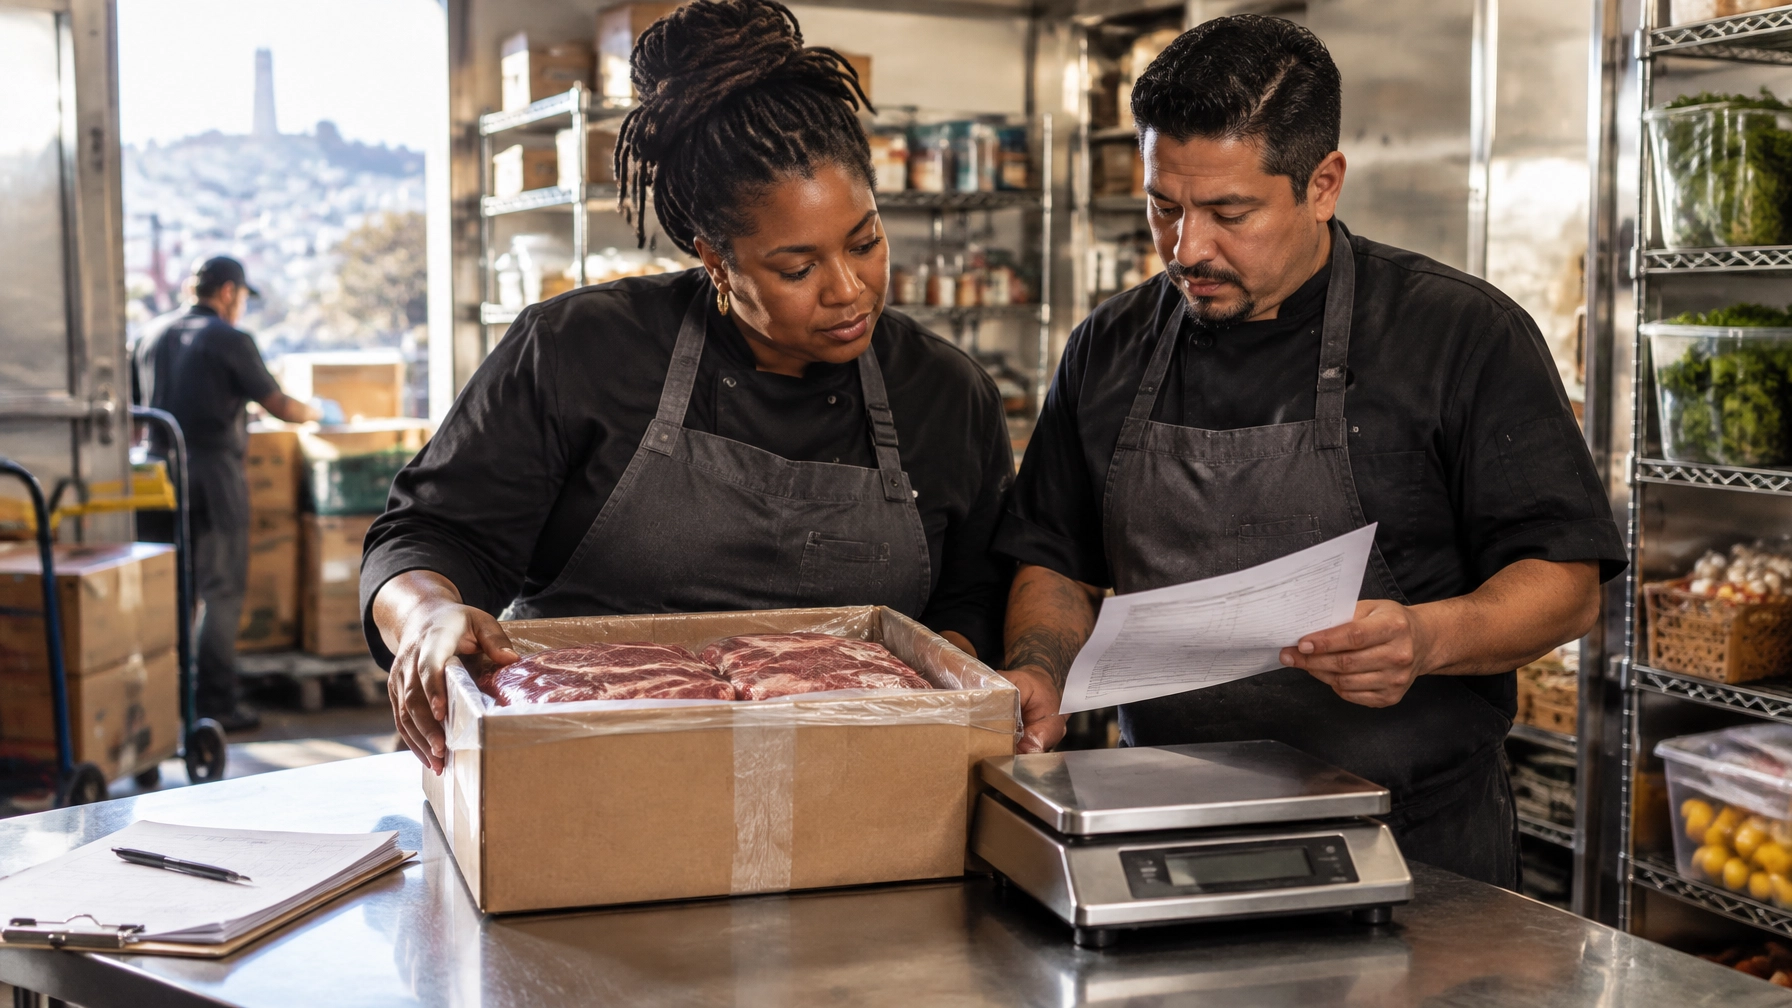
The national averages are only the starting point. Bay Area founders need to model the lease, the buildout, the labor line, and the cash required after opening.
Forty-two percent of restaurant operators said their businesses were not profitable in 2025, according to the National Restaurant Association’s 2026 industry report. At the same time, the industry expects $1.55 trillion in sales this year, with real growth of about 1.3 percent. People are still opening restaurants. They are also opening them into a cost structure that leaves very little room for guessing. [1]
Here is the blunt version: a restaurant can have a strong concept, good food, and a capable team and still run out of money before the model has time to work.
This guide will help you:
- Estimate the capital required for different restaurant formats.
- Separate construction money from working capital.
- Run margin, rent, labor, and break-even math before signing a lease.
The national numbers: what it actually costs to open
RestaurantOwner.com’s independent restaurant survey found a median opening cost of $375,500. The 25th percentile was $175,500, while the 75th percentile reached $750,500. Those figures cover a wide range of concepts, markets, and building conditions. [2]
A Bay Area founder should treat these figures as a national reference point, not a quote for a San Francisco, Oakland, Berkeley, or Peninsula project. Square reports that full-service restaurants in major cities can exceed $1 million once buildout, equipment, staffing, and operating reserves are included. [3]
| Concept type | Median opening cost | Median time to profitability |
|---|---|---|
| Limited service | $225,500 | 4 months |
| Catering, take-out, and delivery | $150,500 | 6 months |
| Bar and tavern | $425,500 | 6 months |
| Full service | $475,500 | 6 months |
Source: RestaurantOwner.com Independent Restaurant Cost to Open Survey. [2]
The median is not a promise. It is a reference point. A second-generation restaurant space with a functioning hood, grease interceptor, electrical service, and usable restrooms may land near the lower end. A cold shell, major code upgrades, or a high-design dining room can move the budget dramatically.
Where the money actually goes
RestaurantOwner.com reports median spending of $200,000 for construction, $95,000 for kitchen and bar equipment, and $20,000 for pre-opening and training. [2] Those three lines alone total $315,000. That leaves only $60,500 beneath the national median for deposits, professional fees, permits, furniture, technology, opening inventory, insurance, launch marketing, and cash after opening.
That is the part founders routinely underestimate.
Square places a full commercial kitchen at roughly $50,000 to $150,000 and restaurant buildout at approximately $100 to $800 per square foot, depending on the space and scope. [3] At 2,000 square feet, that range implies a construction budget of $200,000 to $1.6 million before equipment and operating reserves. That is simple arithmetic, not a Bay Area bid.

Your opening budget should separate these categories:
- Hard costs: construction, plumbing, electrical, HVAC, ventilation, fire suppression, finishes, and equipment.
- Soft costs: architecture, engineering, permits, legal work, accounting, insurance, technology, and design.
- Pre-opening costs: recruiting, payroll during training, menu testing, licenses, initial inventory, and launch marketing.
- Working capital: cash held to fund operations after opening.
Do not use working capital to cover an equipment overrun. Once that happens, the business opens with a weak balance sheet and no room for a slow ramp.
The margin math in 2026
Restaurant economics were difficult before the latest cost increases. The National Restaurant Association reports that food and labor each represented roughly 33 cents of every sales dollar before the pandemic. Other expenses accounted for about 29 percent, leaving a pre-tax profit margin near 5 percent. [4]
Since then, total restaurant expenses have risen 36 percent. Average restaurant employee earnings rose 41 percent from pre-pandemic levels, wholesale food prices increased 35 percent, and menu prices rose 36 percent between February 2020 and May 2026, based on Bureau of Labor Statistics data cited by the Association. [4]
The current margin picture is thinner. A February 2026 SmartBrief interview with the National Restaurant Association’s chief economist reported median pre-tax margins of 2.8 percent for full-service restaurants and 4.0 percent for limited-service restaurants. [5]
That changes the sales target.
If a full-service restaurant produces $2 million in annual sales at a 2.8 percent pre-tax margin, the result is $56,000 before taxes. That is not a large cushion against a rent increase, equipment failure, debt payment, labor inefficiency, or a few soft months.
Founders need to model sales from the bottom up:
- Estimate seats or transactions.
- Estimate realistic turns or daily order volume.
- Set an average check.
- Multiply by operating days.
- Subtract food, labor, occupancy, fees, repairs, insurance, debt service, and administrative costs.
The sales number is not a wish. It is the amount the operation must produce to support the capital invested.
Working capital is the survival line
Working capital means the cash available to pay operating expenses while the business builds a stable sales pattern. Square recommends a reserve covering at least six months of operating expenses. It also reports that many restaurants take one to three years to reach consistent profitability. [3]
RestaurantOwner.com found that half of full-service operators in its survey became profitable within six months, while the upper quartile took 12 months. Limited-service operators reached profitability in a median of four months. [2]
Those figures describe reported operators. They do not tell you how much cash your project needs.
Build the reserve from your own monthly burn:
Monthly operating expenses × reserve months = working capital target
Include payroll, payroll taxes, rent, common area charges, utilities, food, insurance, software, repairs, marketing, debt service, and owner-approved administrative costs. If your projected monthly burn is $80,000, a six-month reserve would be $480,000. That is an illustration of the formula, not a universal benchmark.
A mediocre dish can be fixed. An empty bank account cannot fund the fix. Undercapitalization gives the operator no time to learn, adjust pricing, rebuild the schedule, or correct a production problem.
The failure-rate myth
The familiar claim that 90 percent of restaurants fail is not reliable. Datassential reported a first-year restaurant failure rate of 0.9 percent in 2025, the lowest level it recorded since at least 2018. Before the pandemic, the rate remained below 6 percent. [6]
That statistic needs context. Datassential tracks operating status across a large restaurant database, and its data reflects closures during a specific period. It does not mean every new restaurant is a safe investment.
Fine dining had the highest first-year failure rate among the segments Datassential reviewed, at 4.9 percent. Fast casual and midscale were below 1 percent. [6]
The useful conclusion is not that restaurants are easy to open. It is that founders should stop planning around a myth and start planning around the actual risks: capital gaps, weak market fit, poor cost controls, unrealistic sales assumptions, and spaces that require more infrastructure than expected.
California labor reality
California’s statewide minimum wage is $16.90 per hour effective January 1, 2026. Covered fast-food restaurant employees have a $20.00 per hour minimum. California does not allow employers to use tips as a credit toward the minimum wage obligation. Cities and counties may impose higher local rates. [7]
That means a Bay Area labor model cannot begin with the state minimum and stop there. Build separate assumptions for cooks, dish staff, counter staff, servers, bartenders, supervisors, and managers. Add payroll taxes, workers’ compensation, benefits, overtime exposure, training hours, and recruiting costs.
Define prime cost as food and beverage cost plus labor. This is the operating cost combination that most directly determines whether sales turn into cash. A concept with a complicated menu, low average check, and high staffing requirement needs a very clear productivity plan before it signs a lease.

Rent and occupancy math for the Bay Area
Occupancy cost means the total cost of occupying the space, including base rent and, where applicable, common area charges, property taxes, insurance pass-throughs, and related building costs.
Square reports that restaurant operators often target rent at 6 to 10 percent of projected revenue. [3] Use that as a starting test, not a permission slip. If your projected annual sales are $1.5 million, 10 percent equals $150,000 in annual occupancy cost. If the site requires $250,000, the model must explain where the additional sales or margin will come from.
Older Bay Area spaces create another problem. A site may look restaurant-ready while hiding inadequate electrical capacity, outdated plumbing, insufficient ventilation, fire-life-safety work, accessibility upgrades, or a grease system that cannot support the menu. That is why the lease decision belongs after a feasibility study, not before one.
The pre-lease capital checklist
Before signing a lease or committing serious money, complete these steps:
- Build a sources-and-uses budget that separates hard costs, soft costs, pre-opening expenses, and working capital. [2]
- Obtain contractor pricing based on the actual site, not a generic square-foot assumption. [3]
- Confirm electrical, plumbing, HVAC, ventilation, grease, fire suppression, and restroom conditions.
- Model conservative, likely, and upside sales cases.
- Calculate break-even sales by month, day, and service period.
- Build a labor model using the applicable California and local wage requirements. [7]
- Price equipment against the menu and expected volume. Do not buy capacity you cannot monetize.
- Add a contingency line that remains untouched until a documented need appears.
- Confirm the cash reserve after construction, deposits, opening inventory, training, and launch costs.
- Have qualified legal and financial professionals review the lease, guarantees, financing, and ownership structure.
A strong restaurant business plan should show capital requirements, use of funds, Year 1 sales and profit forecasts, break-even, and a five-year financial outlook. Kitchen and equipment decisions should also be coordinated with the architect and contractor through a kitchen and bar design review.
Key takeaways
- The national median opening cost is $375,500, but the range is wide. [2]
- Full-service restaurants carried a $475,500 median opening cost in the RestaurantOwner.com survey. [2]
- Construction and equipment consume most of the opening budget before the first sale. [2]
- Six months of working capital should be treated as a starting reserve, not excess cash. [3]
- Full-service profitability can take 12 months for slower-ramping operators. [2]
- Full-service median pre-tax margin is 2.8 percent in the current environment. [5]
- California labor assumptions must reflect the $16.90 statewide wage, the $20 fast-food wage where applicable, and local rules. [7]
- The 90 percent restaurant failure claim is a myth, but weak capitalization remains a practical threat. [6]
Actions to take now
At work: Build three versions of your opening budget: lean, likely, and stressed.
At home: Decide how much personal capital you can risk without depending on optimistic restaurant income.
In the community: Walk the proposed trade area at breakfast, lunch, dinner, and late evening. Observe access, parking, traffic, and neighboring businesses.
In civic life: Review the applicable planning, building, health, fire, and wage requirements before you treat a space as viable.
Extra step: Ask an experienced restaurant consultant to review your sources-and-uses budget before you sign the lease.
FAQ
How much does it cost to open a restaurant in 2026?
RestaurantOwner.com reports a $375,500 national median for independent restaurants, with a 25th-to-75th percentile range of $175,500 to $750,500. Square reports that major-city full-service projects can exceed $1 million after buildout, equipment, staffing, and reserves. [2][3]
How much working capital should I keep?
Square recommends a reserve covering at least six months of operating expenses. Calculate your own monthly burn and multiply it by the number of months needed to reach a stable operating pattern. [3]
Is full service more expensive than limited service?
Yes, in the RestaurantOwner.com survey, full service had a $475,500 median opening cost compared with $225,500 for limited service. Full service also carried a six-month median time to profitability, compared with four months for limited service. [2]
Can I use tips to meet California’s minimum wage?
No. California does not allow tips to be used as a credit toward the employer’s minimum wage obligation. [7]
Do 90 percent of restaurants fail?
No. Datassential reported a 0.9 percent first-year failure rate in 2025 and found that the commonly repeated 90 percent figure is false. That finding does not remove the need for careful capitalization, market analysis, and cost control. [6]
What should I do before signing a lease?
Confirm the building’s infrastructure, verify permitting requirements, complete a sources-and-uses budget, model conservative sales, calculate break-even, and protect the post-opening cash reserve. A financial assessment can help connect those decisions.
Three lines worth sharing
- “A restaurant can have a strong concept, good food, and a capable team and still run out of money before the model has time to work.” [1][3]
- “A mediocre dish can be fixed. An empty bank account cannot fund the fix.” [2][3]
- “The sales number is not a wish. It is the amount the operation must produce to support the capital invested.” [2][4]
Schedule a discovery call
If you are evaluating a Bay Area restaurant concept, lease, or capital plan, schedule a discovery call with McFadden Finch Restaurant Consulting Group before the project becomes expensive to change.
Where Smart Strategy Meets Profitable Hospitality.
At McFadden Finch Restaurant Consulting Group, we help restaurant owners make sharper decisions, strengthen operations, and build businesses designed to perform. From feasibility studies and concept development to menu strategy and long-term operational consulting, we help your restaurant move beyond survival and into sustained growth.
McFadden Finch Restaurant Consulting Group
Lake Merritt Plaza
1999 Harrison St., 18th Floor
Oakland, CA 94612
(510) 973-2410
www.mcfadden-finch-group.com
executive.team@mcfadden-finch-group.com
Schedule your discovery call today and start building a stronger, smarter, more profitable restaurant. The corporate office address and email are listed on McFadden Finch Holdings' contact page, and MFRCG is included in the company's hospitality consulting portfolio.
Sources
[1] National Restaurant Association, “Persistent Cost Increases and Enduring Demand Will Shape the Restaurant Industry in 2026,” February 12, 2026, https://restaurant.org/research-and-media/media/press-releases/persistent-cost-increases-and-enduring-demand-will-shape-the-restaurant-industry-in-2026/, Accessed August 24, 2026. Why it matters: Provides the 2026 industry sales projection, real growth estimate, and operator profitability data.
[2] RestaurantOwner.com, “Independent Restaurant Cost to Open Survey,” n.d., https://www.restaurantowner.com/public/CTOSurvey-SummaryReport.pdf, Accessed August 24, 2026. Why it matters: Provides opening cost medians, percentile ranges, spending categories, and time-to-profitability data by concept.
[3] Square, “How Much Does It Cost to Open a Restaurant in the US?,” March 11, 2026, https://squareup.com/us/en/the-bottom-line/starting-your-business/restaurant-start-up-costs, Accessed August 24, 2026. Why it matters: Provides concept cost ranges, buildout and equipment ranges, occupancy guidance, and working capital recommendations.
[4] National Restaurant Association, “Elevated Costs Continue to Pressure Restaurant Profitability,” July 8, 2026, https://restaurant.org/research-and-media/research/restaurant-economic-insights/analysis-commentary/elevated-costs-continue-to-pressure-restaurant-profitability/, Accessed August 24, 2026. Why it matters: Documents the 36 percent increase in total expenses, food and labor cost structure, and menu price movement since 2020.
[5] SmartBrief, “Q&A: Resilience, Customer Experience and the New Value Proposition in the Restaurant Industry,” February 23, 2026, https://www.smartbrief.com/original/qa-resilience-customer-experience-and-the-new-value-proposition-in-the-restaurant-industry, Accessed August 24, 2026. Why it matters: Provides current median pre-tax margin figures for full-service and limited-service restaurants.
[6] Datassential, “Restaurant Failure Rate Plunges in 2025: Datassential Sales Intelligence,” September 11, 2025, https://datassential.com/resource/restaurant-failure-rate/, Accessed August 24, 2026. Why it matters: Corrects the 90 percent failure-rate myth and provides first-year failure data by year and segment.
[7] California Department of Industrial Relations, Division of Labor Standards Enforcement, “Minimum Wage Frequently Asked Questions,” updated December 2025, https://www.dir.ca.gov/dlse/FAQ_MinimumWage.htm, Accessed August 24, 2026. Why it matters: Confirms California’s 2026 statewide minimum wage, the fast-food wage reference, local wage rules, and prohibition on tip credits.
[8] McFadden Finch Restaurant Consulting Group, “Business Plan,” n.d., https://www.mcfadden-finch-group.com/services/business-plan/, Accessed August 24, 2026. Why it matters: Describes the financial planning elements founders should include in a restaurant business plan.
[9] McFadden Finch Restaurant Consulting Group, “Kitchen & Bar Design Consulting,” n.d., https://www.mcfadden-finch-group.com/services/kitchen-bar-design-consulting/, Accessed August 24, 2026. Why it matters: Supports the recommendation to coordinate kitchen layout and equipment decisions with the project architect and contractor.
[10] McFadden Finch Restaurant Consulting Group, “Looking for a Feasibility Report of Restaurant? 10 Things You Should Know Before You Sign a Lease,” n.d., https://www.mcfadden-finch-group.com/looking-for-a-feasibility-report-of-restaurant-10-things-you-should-know-before-you-sign-a-lease, Accessed August 24, 2026. Why it matters: Provides relevant internal guidance on reviewing a restaurant site before lease commitment.
Disclaimer: This content is for general informational purposes only and does not constitute legal, financial, tax, operational, employment, regulatory, or other professional advice. Reading this content does not create a client, consulting, or contractual relationship with McFadden Finch Restaurant Consulting Group. Because every restaurant, market, and business situation is different, you should consult qualified professionals regarding your specific circumstances. McFadden Finch Restaurant Consulting Group makes no warranties regarding the accuracy or completeness of this information and is not responsible for third-party content, links, products, or services referenced. Testimonials, examples, case studies, and projected outcomes are illustrative only and do not guarantee similar results.