
Based on the analysis of California’s shifting labor market, story researched by MFRCG Staff.
Intent Tag: Education
On January 1, 2026, California’s minimum wage moved to $16.90/hour—and for a lot of operators, it’s not the $0.40 that hurts. It’s the math that follows it everywhere: every station, every shift change, every “can you stay late,” every training hour that used to feel small.
If you’re running a restaurant in Oakland, San Francisco, or the East Bay, you’re feeling it fast because you’re already operating in a market where wages are rarely “minimum” in practice. You’re competing with other employers, you’re covering call-outs, you’re dealing with tighter applicant pools, and you’re trying to protect guest experience while everyone’s cost base climbs.
And here’s the real stake: in 2026, wage pressure is the forcing function that exposes whether your restaurant is built on systems—or built on hustle. Hustle gets you through a weekend. Systems protect your margins all year.
This post breaks down what’s actually changing with the 2026 wage hike, why “just raise prices” isn’t a plan, and how to rebuild margin using practical levers you can control—staffing precision, menu contribution margin, and waste + throughput.
Primary keyword: California minimum wage 2026
Supporting keywords: restaurant labor costs California, prime cost, menu engineering, contribution margin, labor audit, scheduling efficiency, Bay Area restaurants, wage compression, food waste reduction, restaurant profitability
The question isn’t whether labor costs increased. The question is whether your operating model can absorb it and still hit the profit you need.
What actually changed in 2026 (and why it hits harder than it looks)
Point: The wage floor moved, but the bigger impact is how that floor ripples through your whole pay structure and operating rhythm.
Evidence: California’s statewide minimum wage is $16.90/hour as of January 1, 2026 for employers, per the State of California’s Department of Industrial Relations (DIR) [California DIR][1]. A $0.40 increase can look small on paper, but it applies to every minimum-wage hour you schedule—and in restaurants, that’s a lot of hours. On top of that, many cities and counties set higher local minimum wages, so multi-location groups and Bay Area operators may be living in a patchwork of rates [UC Berkeley Labor Center][2].
Separately, if you operate a fast food restaurant covered by California’s fast food minimum wage law, the minimum wage for those workers is on a different track and can be higher [California DIR][1].
Practical meaning: In 2026, the restaurants that “feel fine” after wage hikes are the ones that already know, by daypart, what each labor hour produces—and can adjust staffing, menus, and prep accordingly. The restaurants that get squeezed are the ones using broad rules of thumb (“we run 5 on the floor at dinner”) rather than a measurable labor model.
The real problem isn’t the wage floor—it’s unmanaged prime cost
Point: The $16.90 number isn’t the core issue. The core issue is prime cost (labor + COGS) drifting upward while sales mix and throughput stay the same.
Evidence: In a typical restaurant P&L, prime cost is the biggest controllable cost bucket [RestaurantOwner.com][3]. When wages rise and you don’t redesign the way work moves through the building, labor percent climbs. When vendors and waste aren’t controlled, food cost climbs. And if you respond by only raising prices, you can lose traffic before you fix the underlying unit economics [National Restaurant Association][4]. “Food away from home” inflation is also a real backdrop that shapes guest sensitivity [U.S. Bureau of Labor Statistics][5].
Practical meaning: The goal in 2026 isn’t “pay less” (you can’t). The goal is get more output per paid hour and more profit per ticket—without torching guest experience.
Most operators respond to wage increases with three predictable moves:
- Raise menu prices across the board
- Reduce staff hours or headcount
- Accept lower profit margins
Those are understandable, but incomplete. Across-the-board price hikes can misprice your menu (you raise the wrong items, not the right ones). Cutting hours without redesigning the shift creates service gaps. And accepting lower margins ignores the real issue: margin leakage you can actually fix.

The restaurants that survive and grow through wage increases rebuild margin from the foundation: contribution margin by item, labor efficiency by daypart, and tight waste controls.
Popularity is a vanity metric (contribution margin is the real scoreboard)
Point: Best-sellers can quietly destroy your margins if they’re labor-heavy, discount-prone, or waste-prone.
Evidence: Menu engineering separates items by popularity and profitability, and the profitability side is about contribution margin (what’s left after item-level variable costs) [Kasavana & Smith][6]. If a dish is popular but requires extra touches, low-skilled labor can’t execute it consistently, or it increases remake rates, your “hit” becomes a drag [Cornell SC Johnson College of Business][7].
Practical meaning: In a $16.90 labor world, you don’t just ask “What sells?” You ask:
- What sells and produces margin?
- What sells but slows the line, spikes overtime, or increases waste?
- What should be featured because it’s profitable and easy to execute consistently?
This is where the margin rebuild starts. Instead of cutting broadly, analyze menu items for true contribution margin after accounting for:
- Food cost (actual recipe cost + yield loss)
- Labor touch time (prep + pickup + garnish complexity)
- Waste/remakes/voids
- Packaging (if applicable)
The operating shift looks like this:
Before
- Focus on best-selling items
- Price based on food-cost percentage
- Staff based on historical patterns
After
- Focus on highest contribution margin items
- Price based on total prime cost (food + labor) and market position
- Staff based on forecasted demand and throughput constraints
You don’t need “perfect data” to do this—just a clean recipe file, tighter POS reporting, and a willingness to measure what’s really happening.
The margin rebuild playbook (built for a $16.90 floor)
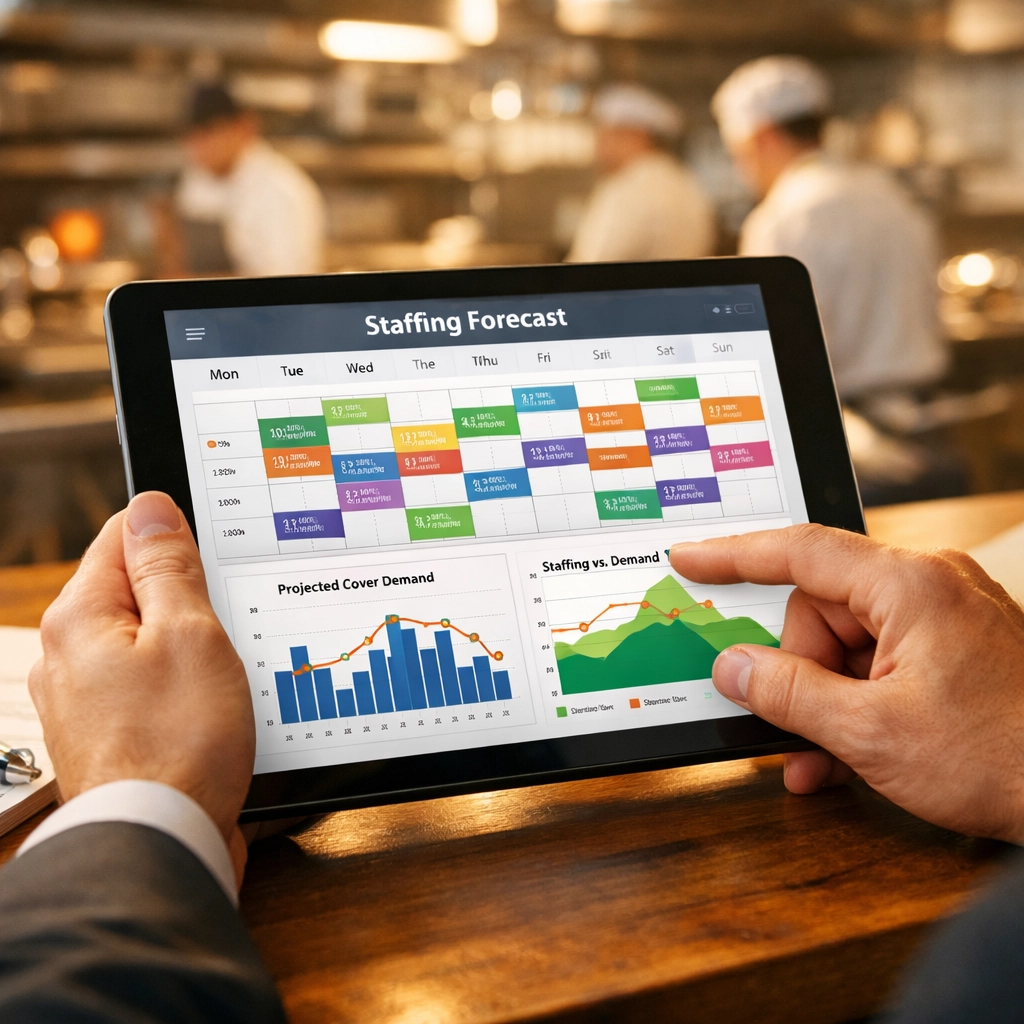
1) Staffing precision: schedule to demand, not vibes
Point: A wage hike turns small scheduling misses into big money.
Evidence: Labor is one of the largest costs in restaurants, and in a tight labor market, the “hidden costs” (turnover, training, mistakes) stack on top [National Restaurant Association][4]. Tools that use sales history and demand drivers (reservations, events, weather, ordering channel mix) can help managers schedule tighter [Cornell SC Johnson College of Business][8]. Even without advanced forecasting software, you can get a meaningful win by tightening your labor standards and demand tracking.
Practical meaning: Your goal is to reduce “dead labor” without creating service failure. That means:
- Build a simple labor standards sheet by role (covers/hour or transactions/hour)
- Forecast by daypart (not just daily sales)
- Lock a “minimum viable floor” staffing plan and a “surge plan”
- Track overtime triggers weekly and correct early
2) Menu engineering for contribution margin (not food-cost %)
Point: Food-cost % can lie when labor is rising.
Evidence: Menu engineering evaluates items on profitability and popularity and helps you decide what to feature, reprice, reformulate, or remove [Kasavana & Smith][6]. With higher wages, labor touch time becomes a bigger part of item-level cost [Cornell SC Johnson College of Business][7].
Practical meaning: Do a weekly “profit mix” review:
- Contribution margin per item (price – recipe cost – packaging – estimated labor touch time)
- Complexity score (how many steps, components, pickup time)
- Waste/remake/void frequency (POS + manager log)
- Speed impact (does it slow the line?)
Then make targeted changes (not blanket price increases):
- Reprice the items customers already expect to pay more for
- Reformulate labor-heavy items (fewer touches, batchable components)
- Create one or two “anchor” high-margin items you can confidently recommend
3) Throughput + waste systems: protect food dollars and labor minutes
Point: Waste is a double hit: you pay for the food and you pay labor to handle it.
Evidence: Waste and spoilage often come from forecasting misses, inconsistent portioning, and weak receiving/storage discipline. Tightening pars, recipes, and FIFO reduces food cost volatility and reduces “extra work” created by chaos [USDA Food Loss and Waste][9]. Food safety handling standards also reinforce why storage discipline matters [ServSafe][10].
Practical meaning: Focus on boring systems that work:
- Standard recipes with weights, yields, and photos
- Par sheets by daypart (not “one par for all days”)
- Prep lists tied to forecasted volume
- FIFO zones labeled and enforced
- A weekly waste log with 3 root causes and 3 fixes
Visual data: wage increase vs. required sales or margin improvement (simple model)
Below is a comparison grid you can use to sanity-check your exposure. It’s not a full pro forma—just a “directionally correct” tool to show why operators feel the squeeze.
Assumptions: 1,000 paid hours/month at roles near the minimum wage; wage goes from $16.50 to $16.90 (+$0.40); employer payroll taxes/workers’ comp/benefits not included.
| Scenario | Old wage ($16.50) | New wage ($16.90) | Monthly labor $ change (1,000 hrs) | What it means if you don’t change ops |
|---|---|---|---|---|
| Minimum-wage hours steady | $16,500 | $16,900 | +$400/month | You need +$400/month in extra contribution margin just to stay even. |
| 1,500 hours/month | $24,750 | $25,350 | +$600/month | This is why “small” raises feel big in high-hour operations. |
| 2,500 hours/month | $41,250 | $42,250 | +$1,000/month | If your margins are thin, this can erase your monthly profit. |
The takeaway: if you’re not creating extra contribution margin through better scheduling, menu mix, and waste control, the math catches you quickly—especially if you’re already dealing with wage compression across pay bands.
Bay Area reality check: your competition isn’t “cheaper labor,” it’s better systems
Point: In Oakland, San Francisco, and the East Bay, you’re not competing in a low-wage environment—so the edge has to come from execution.
Evidence: Many Bay Area jurisdictions set local minimum wages above the state floor, and operators often pay above minimum to recruit and retain [UC Berkeley Labor Center][2].
At the same time, guest price sensitivity is real. “Food away from home” prices have been elevated in recent years, and consumers notice [U.S. Bureau of Labor Statistics][5].
Practical meaning: If you’re trying to “win” by paying less, you lose—either to competitors who pay more, or to turnover that wrecks your training and consistency. The workable strategy is:
- Raise productivity per labor hour (throughput, cross-training, better deployment)
- Increase contribution margin per transaction (menu mix and targeted pricing)
- Reduce avoidable loss (waste, comps, remakes, theft, discounts)
That’s how you protect margin without turning your restaurant into a miserable place to work or dine.
Smart Critic: “Isn’t this just greedflation?” and “Why not just raise prices?”
Point: The loudest counterarguments miss how restaurant economics actually work.
Critic argument #1: “Raising prices is greedflation.”
Evidence: In restaurants, price increases are often a response to cost increases (labor, food inputs, rent, utilities) rather than a simple margin grab—especially for independents operating on thin net margins [National Restaurant Association][4]. At the same time, it’s fair for guests to demand value and transparency, and inflation context shapes that perception [U.S. Bureau of Labor Statistics][5].
Practical meaning: The right move isn’t “never raise prices.” It’s don’t use price as your only lever. If you raise prices without fixing throughput, waste, and menu mix, you can still lose money—just with fewer guests.
Critic argument #2: “Just raise prices 3% and you’re done.”
Evidence: Demand is not perfectly inelastic. Price sensitivity varies by concept, neighborhood, and channel (dine-in vs delivery). Blanket increases can push your best value items out of the sweet spot and reduce traffic [Cornell SC Johnson College of Business][7].
Practical meaning: Use targeted pricing and menu architecture:
- Increase prices where you have pricing power and strong perceived value
- Protect “traffic drivers” that bring people in
- Engineer bundles and add-ons that lift check without feeling like a gouge
- Reduce labor per plate so you’re not “pricing your way out of the market”
You can be pro-worker, pro-guest, and pro-profit at the same time—if you run the business with a system instead of a reaction.
The profitability audit (where margin rebuild actually starts)
Point: If you don’t measure the leak, you can’t fix it.
Evidence: Many restaurant P&Ls hide operational issues because costs are aggregated (weekly labor as one line, food cost as one line) while the problems are specific (a single daypart overstaffed, a few items underpriced, one station creating consistent waste) [RestaurantOwner.com][11].
Practical meaning: A real audit looks at:
- Prime cost by daypart (breakfast/lunch/dinner/late-night)
- Labor efficiency by shift and by role (not just total labor %)
- Recipe accuracy + portion control adherence
- Void/comp/discount patterns
- Waste by category and root cause
- Speed of service and where the line gets stuck
That’s the foundation for fixing labor and margin in a way that sticks.
What to do next (a concrete 2026 action list)
- Run a 30-day labor audit: hours by role, by daypart, by channel (dine-in, takeout, delivery).
- Set labor standards (covers/hour or transactions/hour) and track weekly variance.
- Rebuild your schedule around the $16.90 floor: define minimum staffing, surge staffing, and cut triggers.
- Calculate contribution margin for every item using recipe cost + packaging + estimated labor touch time.
- Do menu engineering for a $16.90 world: feature high-margin, low-complexity items; fix or remove margin killers.
- Create a “prep-to-forecast” system: pars and prep lists tied to daypart projections, not habit.
- Tighten portion control: weights, scoops, ladles, and a weekly plate-cost spot check.
- Attack waste with a weekly log: top 5 waste items, root cause, corrective action, owner sign-off.
- Cross-train for flexibility: fewer “single-point-of-failure” roles during call-outs and rushes.
- Build a weekly prime cost dashboard: labor %, COGS %, prime cost %, and top 5 drivers—reviewed every Monday.
FAQ (for California restaurant operators)
1) Do I need to reprice my whole menu because California minimum wage is $16.90 in 2026?
Not necessarily. Start with contribution margin and labor touch time. Many restaurants can stay competitive by repricing a handful of items, improving mix, and tightening scheduling rather than applying a blanket increase.
2) How do I estimate labor cost per menu item without complicated software?
Time the pickup and build steps (prep and line) for your top items, estimate minutes per plate, and apply an hourly labor rate. It won’t be perfect, but it will quickly show which items are labor-heavy for the margin they deliver.
3) What’s the fastest way to reduce labor cost without hurting service?
Deploy smarter by daypart: tighten open/close, reduce overlap where it isn’t needed, and build a surge plan so you’re not overstaffed “just in case.” Combine that with cross-training so you can flex.
4) How do I handle wage compression when new hires are close to what leads make?
Treat it as a structure problem: define clear skill tiers, adjust lead pay strategically, and tie raises to measurable capability (speed, cross-station proficiency, trainer role). If you ignore compression, you often lose your strongest people first.
5) I’m in a city with a higher local minimum wage—does this advice still apply?
Yes. Higher local wages just raise the urgency. The levers are the same: contribution margin, throughput, waste controls, and scheduling precision.
Discovery Call (single CTA)
If you want help pressure-testing your labor model, menu contribution margins, and a realistic plan to protect profit under the California minimum wage 2026 reality, book a Discovery Call with the Executive Team at McFadden Finch Restaurant Consulting Group:
https://mcfadden-finch-group.com/contact
McFadden Finch Restaurant Consulting Group (Footer)
McFadden Finch Restaurant Consulting Group helps restaurant owners and operators launch new concepts, fix struggling locations, and tighten operations so the food, brand, and numbers work together. Services include feasibility and business planning, concept development, menu strategy, restaurant turnarounds, operations systems and training support, kitchen and bar design consulting, and management recruiting.
Phone: (510) 973-2410
Website: https://www.mcfadden-finch-group.com
Sources
[1] California Department of Industrial Relations, “Minimum Wage,” State of California, 2026, https://www.dir.ca.gov/dlse/minimum_wage.htm, Accessed February 7, 2026.
[2] UC Berkeley Labor Center, “Inventory of U.S. City and County Minimum Wage Ordinances,” UC Berkeley, 2026, https://laborcenter.berkeley.edu/inventory-of-us-city-and-county-minimum-wage-ordinances/, Accessed February 7, 2026.
[3] RestaurantOwner.com, “Prime Cost: Definition and How to Calculate It,” RestaurantOwner.com, n.d., https://www.restaurantowner.com/public/Prime-Cost.cfm, Accessed February 7, 2026.
[4] National Restaurant Association, “2025 State of the Restaurant Industry,” National Restaurant Association, 2025, https://restaurant.org/research-and-media/research/reports/state-of-the-restaurant-industry/, Accessed February 7, 2026.
[5] U.S. Bureau of Labor Statistics, “Consumer Price Index — Food Away From Home (CUUR0000SEFV),” U.S. Bureau of Labor Statistics, 2026, https://www.bls.gov/cpi/, Accessed February 7, 2026.
[6] Michael L. Kasavana and Donald I. Smith, “Menu Engineering: A Practical Guide to Menu Analysis,” (various editions), Hospitality publishers, n.d., https://scholar.google.com/scholar?q=Kasavana+Smith+menu+engineering, Accessed February 7, 2026.
[7] Cornell SC Johnson College of Business (Cornell Hospitality), “Menu Design and Consumer Behavior (research and insights),” Cornell University, n.d., https://business.cornell.edu/faculty-research/centers-institutes/cornell-institute-for-food-systems/, Accessed February 7, 2026.
[8] Cornell SC Johnson College of Business (Cornell Hospitality), “Service Operations and Labor Productivity (research and insights),” Cornell University, n.d., https://business.cornell.edu/faculty-research/, Accessed February 7, 2026.
[9] U.S. Department of Agriculture, “Food Loss and Waste,” USDA, n.d., https://www.usda.gov/foodlossandwaste, Accessed February 7, 2026.
[10] National Restaurant Association Educational Foundation, “ServSafe Food Handler / Food Safety Training,” ServSafe, n.d., https://www.servsafe.com/, Accessed February 7, 2026.
[11] RestaurantOwner.com, “Operational Controls (restaurant management resources),” RestaurantOwner.com, n.d., https://www.restaurantowner.com/, Accessed February 7, 2026.