To beat the 2026 margin squeeze in the Bay Area, restaurant operators must pivot from chasing top-line revenue to a "Margin-First" model. This is achieved by calculating every dish based on prime cost (food plus labor) rather than food cost alone, implementing cross-training to boost labor efficiency, and standardizing SOPs to eliminate waste. By focusing on contribution margins: ranking dishes by their actual profitability after all variable costs: operators can protect their bottom line even as labor costs in San Francisco and Oakland continue to climb toward record highs.
The 2026 Bay Area Reality: Why the Old Math is Broken
Running a restaurant in the San Francisco Bay Area has always been a game of inches, but 2026 has turned it into a game of millimeters. As of early 2026, the combined pressure of San Francisco’s minimum wage reaching new peaks and mandatory healthcare expenditures has pushed the average labor cost for full-service restaurants to nearly 38% of gross sales (SF Office of Labor Standards Enforcement) [3]. When you add in food costs that remain stubbornly high due to supply chain shifts, many "successful" legacy spots are finding themselves in a cash flow desert.
The traditional "30% food cost" rule is officially dead. In this market, a restaurant turnaround isn't just about getting more people through the door; it’s about making sure the people already coming in are ordering the right things. In late 2025, California saw a 3.5% drop in restaurant traffic even as menu prices rose (Golden Gate Restaurant Association) [4]. This "price fatigue" means you can’t simply pass every cost increase onto the guest. You have to out-operate the squeeze.
1. Master Your Prime Cost: Engineering the Menu for Net Profit
Most owners look at their P&L at the end of the month and wonder where the money went. The problem usually starts with the menu. To survive 2026, you must stop looking at food cost in a vacuum and start living by prime cost: the sum of your Cost of Goods Sold (COGS) and total labor (U.S. Bureau of Labor Statistics) [1].
In San Francisco restaurant management, a dish might have a stellar 25% food cost, but if it requires 15 minutes of hands-on line cook time at $24/hour, that "profitable" dish is actually a margin killer.
How to Engineer for Margin:
- Calculate Contribution Margin: Instead of looking at percentages, look at the dollar amount left over after COGS and direct labor. If Dish A brings in $12 in profit and Dish B brings in $8, you want your staff pushing Dish A every single time, even if Dish B has a "better" food cost percentage.
- Kill the "Dogs": Use a menu engineering matrix to identify dishes with low popularity and low profitability. In a high-rent environment like Oakland or Palo Alto, every square inch of your menu must earn its keep.
- Passive vs. Active Labor: Prioritize dishes that involve passive cooking (braising, roasting) over active labor (intensive sauté, intricate plating).

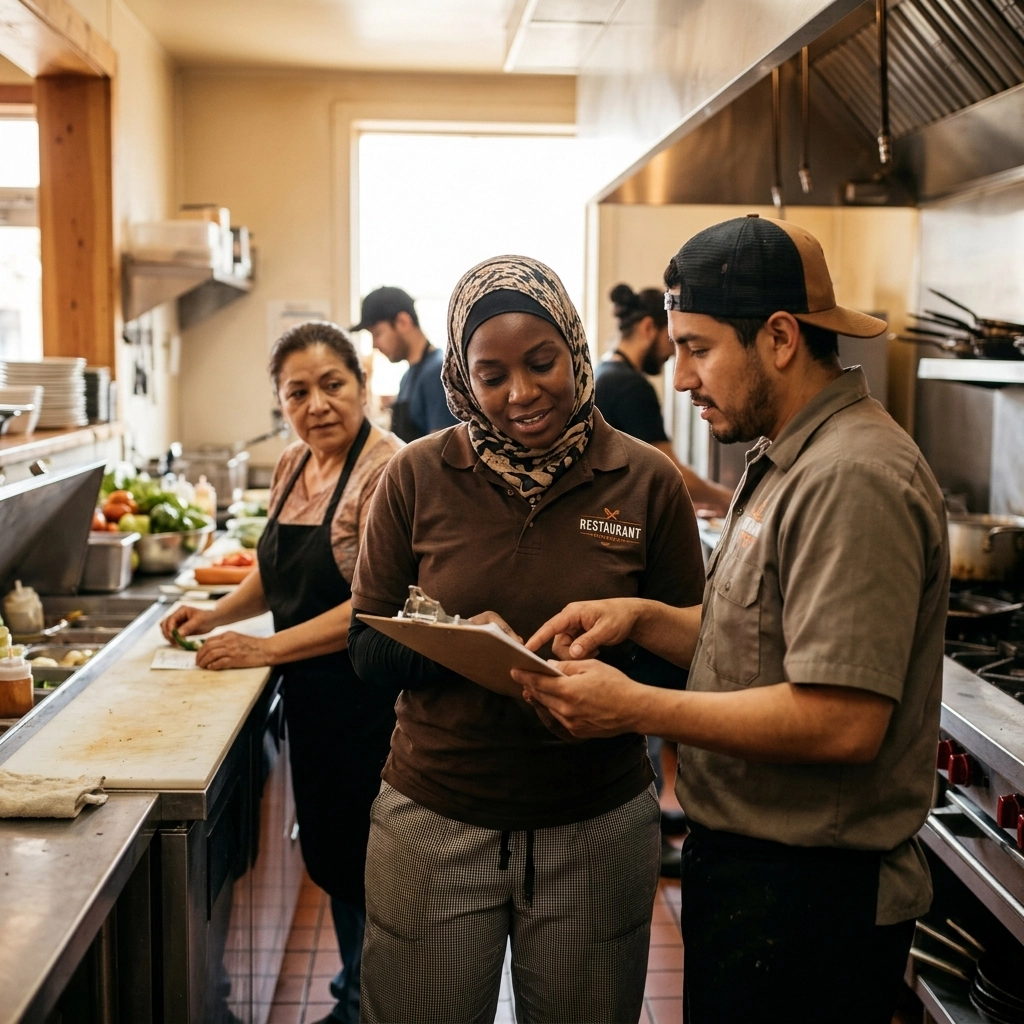
Caption: A modern dashboard showing the breakdown of prime costs vs. net profit margins.
2. Radical Labor Efficiency through Cross-Training
Labor is no longer a controllable variable; it is a fixed reality of the Bay Area market. With the San Francisco minimum wage and healthcare mandates creating a high floor for expenses, the only way to lower your labor percentage is to increase the output per man-hour (California Department of Industrial Relations) [2].
This is where many restaurant consulting strategies focus first. If your dishwasher can’t prep and your servers can’t run food or bus tables, you are over-staffed and under-productive.
The Cross-Training Playbook:
- Skill Mapping: Identify the "low-complexity, high-impact" tasks in each department.
- The "Flex" Position: Train one person per shift who can float between the front and back of the house. This reduces the need for that extra "just in case" body on the floor.
- Incentivize Versatility: Create a tiered pay structure where employees earn more as they master different stations. This improves retention: a massive cost saver in a market where hiring a new cook can cost $3,000 in lost productivity and training (National Restaurant Association) [5].
Improving labor efficiency isn't about making people work harder; it's about making the workflow smarter so that fewer people can handle the same volume without burning out.
3. Implementing SOPs to Stop the "Death by a Thousand Cuts"
Small leaks sink big ships. In a 2026 restaurant turnaround, we often find that 2% to 4% of potential margin is lost simply because there are no SOPs (Standard Operating Procedures). Without a standard, there is no accountability.
Waste in the kitchen, over-pouring at the bar, and inconsistent portions are margin killers. When an Oakland taqueria raised its prices by $4 over 18 months, it lost 22% of its volume (Oakland Chamber of Commerce) [8]. When volume drops, you cannot afford a single ounce of waste.
Essential SOPs for 2026:
- The Theoretical vs. Actual (TvA) Gap: You should know exactly how much protein or liquor you should have used based on sales versus what you actually used. A gap larger than 2% requires immediate intervention.
- Closing & Opening Checklists: Energy costs in the Bay Area are among the highest in the nation. SOPs that ensure equipment is turned off and refrigeration seals are checked can save hundreds a month.
- Standardized Prep Sheets: Over-prepping leads to spoilage. Use historical sales data to dictate exactly how much should be prepped each day.
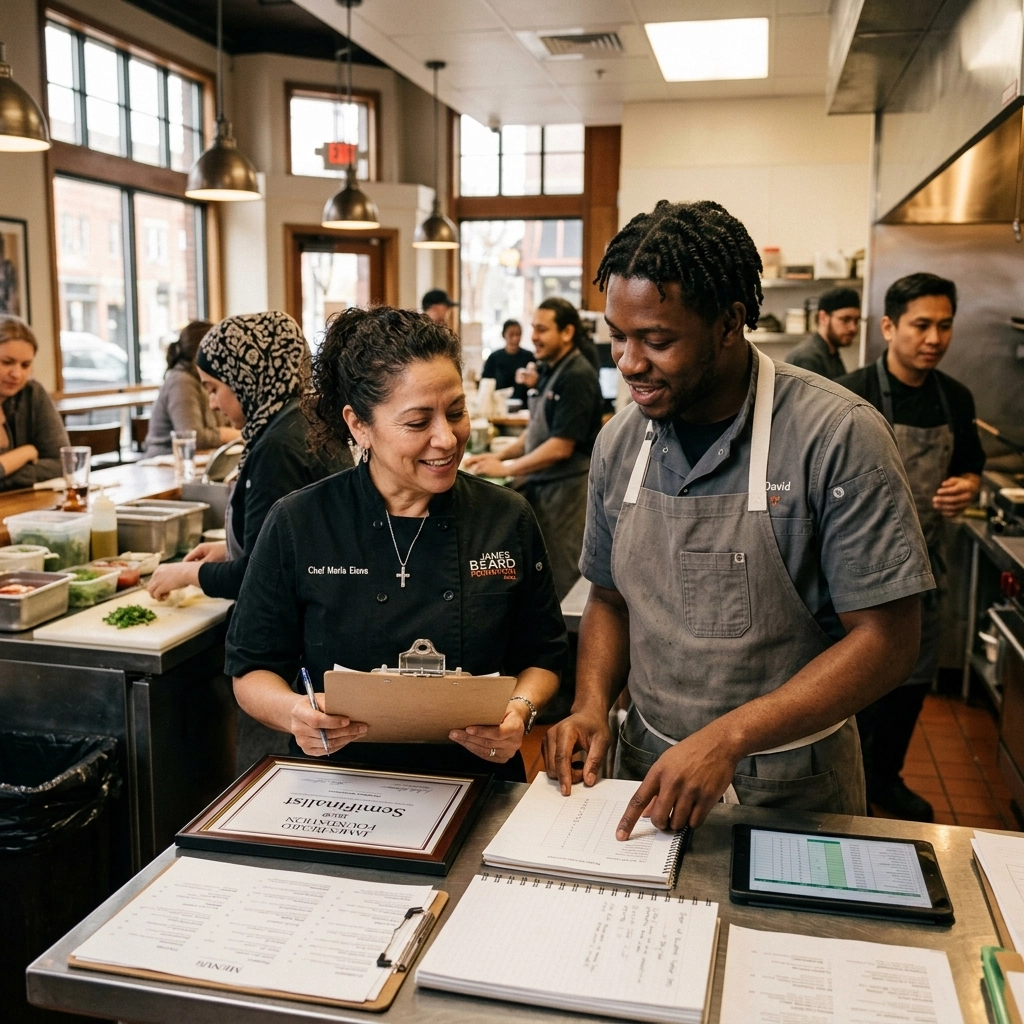
Caption: A professional kitchen environment where standardized prep stations ensure consistency and waste reduction.
The Margin Squeeze Data: 2025 vs. 2026 Comparison
To understand the urgency, look at how the "Middle" of the P&L has shifted for a typical $2M/year Bay Area restaurant.
| Expense Category | 2025 Average (%) | 2026 Projected (%) | Impact on $2M Revenue |
|---|---|---|---|
| Cost of Goods (COGS) | 31.0% | 33.5% | +$50,000 cost |
| Labor (Wages + Tax) | 34.0% | 37.5% | +$70,000 cost |
| Occupancy/Utilities | 8.5% | 9.5% | +$20,000 cost |
| Net Profit | 6.5% | -0.5% | $140,000 Loss of Profit |
Data synthesized from industry trends [1], [4], and [9].
Without the operational moves mentioned above: specifically targeting a reduction in prime cost: the average independent restaurant in San Francisco is trending toward a net loss in 2026.
12-Month Restaurant Turnaround Timeline
If you find your margins thinning, you need a structured plan. Here is how a typical restaurant turnaround service at McFadden Finch Group structures a recovery.
- Month 1: Financial Audit & Prime Cost Baseline. Identify where the cash is bleeding (Federal Reserve Bank of San Francisco) [9].
- Month 2: Menu Engineering Phase 1. Remove the "Dogs" and adjust pricing for high-labor items.
- Month 3: Launch Standardized SOPs for inventory and prep.
- Month 4: Initial Cross-Training of core staff.
- Month 5: Implement Weekly Margin Tracking. Move away from monthly reviews.
- Month 6: Review Vendor Contracts. Leverage collective buying power or switch to seasonal local sourcing to lower COGS (Cornell Hospitality Quarterly) [11].
- Month 8: Performance Review. Adjust labor models based on 6 months of data.
- Month 10: Technology Integration. Update POS and inventory software to automate tracking (Toast 2025 Report) [6].
- Month 12: Stabilization. Target net margins of 10%+ in the new economy.
Case Example: The Mission District Turnaround
A 60-seat bistro in San Francisco’s Mission District was facing a crisis in late 2025. Despite being "busy" on Friday and Saturday nights, the owner was barely able to cover payroll. Their labor cost had hit 41% due to an over-reliance on specialized roles: one person for salads, one for grill, one for expo: regardless of the volume.
Working with our operations consulting team, they moved to a "pod" system. Line cooks were trained on all stations, and the menu was simplified from 22 items to 14, focusing on dishes with high contribution margins.
By the first quarter of 2026, they reduced food cost from 34% to 31% and cut labor per plate by 8%. This didn't just save the business; it added over $38,000 in annual profit on a $1.2M revenue base (Berkeley Economic Review) [12]. They stopped chasing the "big Saturday" and started winning the "average Tuesday" by being leaner.
What Smart Critics Argue
Some industry veterans argue that "standardization" and "efficiency" are just corporate code words for "cutting corners" and "losing soul."
Critique 1: Efficiency Kills Quality.
Critics suggest that simplified menus and cross-trained staff lead to a generic dining experience. However, data shows that a smaller, focused menu often leads to higher execution quality. When a kitchen does 12 things perfectly rather than 30 things adequately, customer satisfaction scores actually rise (McKinsey & Co.) [10].
Critique 2: You Can't "System" Your Way Out of High Rent.
Some argue that Bay Area real estate is the real killer, not operations. While rent is high, it is a fixed cost. You cannot change your lease overnight, but you can change your variable costs: Labor and COGS: immediately. Controlled variables are the only lever you have to offset the fixed ones.
Key Takeaways for 2026
- Prime Cost is King: Total food and labor costs should stay between 55% and 65% of sales to remain healthy in the Bay Area [4].
- Labor per Plate: Track how many minutes of labor go into every dish. If it's too high, re-engineer the dish or the station.
- Weekly Discipline: Catching a 2% food cost spike on Tuesday is a fix. Catching it at the end of the month is a funeral.
- Menu Engineering: Use the McFadden Finch Menu Engineering Playbook to rank dishes by contribution margin, not just popularity.
- Cross-Train or Die: Rigid roles are a luxury the 2026 market cannot afford.
- Standardize Everything: If it isn't written down in an SOP, it isn't being done correctly.
- Focus on Profit, Not Volume: A $40k week at 15% profit is better than a $50k week at 5% profit.
6 Actions You Can Take Today
At Work:
Perform a "Menu Audit" today. Identify your top 3 sellers and calculate their current prime cost based on 2026 wages. If they aren't yielding at least a 65% contribution margin, they need a recipe or price adjustment.
In the Back of the House:
Implement a "Waste Log" for one week. Require every scrap of food thrown away to be recorded. You’ll likely find hundreds of dollars in "hidden" losses.
At Home:
Review your P&L from the last 90 days. Calculate your labor as a percentage of gross sales. If it’s over 35%, your first priority is a staffing model overhaul.
In the Community:
Talk to other local owners in Oakland or SF. Many are facing the same squeeze. Peer-to-peer insights on vendor pricing or local labor trends are invaluable.
In Civic Life:
Stay informed on San Francisco's local mandates. The SF Office of Labor Standards Enforcement updates requirements frequently; non-compliance fines are a margin-killer you can avoid.
The Extra Step:
Schedule a professional feasibility study or operational audit. Having an outside expert find the "blind spots" in your P&L can often pay for itself within the first 60 days of implementation.
FAQ
Q: What is a good prime cost for a San Francisco restaurant in 2026?
A: Ideally, you want to sit between 58% and 63%. With the high cost of occupancy and utilities in the Bay Area, anything over 68% puts you in the danger zone for net loss.
Q: Can I just raise my prices to beat the squeeze?
A: Only to a point. "Price fatigue" is real. Most operators find better success in "stealth" price increases: reducing portion sizes slightly or swapping out expensive ingredients: than in flat menu price hikes.
Q: Why is "Restaurant Turnaround" different from regular consulting?
A: A turnaround is an emergency intervention. It’s for businesses that are currently losing money or are one bad month away from closure. It focuses on immediate cash flow and radical expense reduction.
Q: Does cross-training lead to higher turnover?
A: Actually, the opposite. Employees who feel they are learning new skills and are more integral to the operation often stay longer, especially if tied to a "pay-for-skill" program.
Q: How often should I update my SOPs?
A: SOPs should be reviewed quarterly. In a fast-moving market like the Bay Area, things like utility costs or vendor availability change too quickly for an annual review.
If your margins are feeling the heat, don't wait for the next quarterly report to see if things improve. The 2026 market doesn't reward hope; it rewards systems.
Where Smart Strategy Meets Profitable Hospitality.
At McFadden Finch Restaurant Consulting Group, we help restaurant owners make sharper decisions, strengthen operations, and build businesses designed to perform. From feasibility studies and concept development to menu strategy and long-term operational consulting, we help your restaurant move beyond survival and into sustained growth.
McFadden Finch Restaurant Consulting Group
Lake Merritt Plaza
1999 Harrison St., 18th Floor
Oakland, CA 94612
(510) 973-2410
www.mcfadden-finch-group.com
executive.team@mcfadden-finch-group.com
Schedule your discovery call today and start building a stronger, smarter, more profitable restaurant. The corporate office address and email are listed on McFadden Finch Holdings’ contact page, and MFRCG is included in the company’s hospitality consulting portfolio.
Sources
[1] U.S. Bureau of Labor Statistics, "Producer Price Index – Food and Labor Trends," January 2026, https://www.bls.gov, Accessed March 15, 2026.
[2] California Department of Industrial Relations, "Minimum Wage Frequently Asked Questions," January 2026, https://www.dir.ca.gov, Accessed March 15, 2026.
[3] SF Office of Labor Standards Enforcement, "Health Care Security Ordinance (HCSO) 2026 Rates," https://sf.gov/olse, Accessed March 15, 2026.
[4] Golden Gate Restaurant Association, "2025 State of the Industry Report," December 2025, https://ggra.org, Accessed March 15, 2026.
[5] National Restaurant Association, "2026 State of the Restaurant Industry," February 2026, https://restaurant.org, Accessed March 15, 2026.
[6] Toast, "Restaurant Trends Report: Labor and Tech 2025," October 2025, https://pos.toasttab.com, Accessed March 15, 2026.
[7] SF Chronicle, "Bay Area Dining Costs Hit New Peak," January 2026, https://www.sfchronicle.com, Accessed March 15, 2026.
[8] Oakland Chamber of Commerce, "Economic Outlook: East Bay Hospitality," November 2025, https://www.oaklandchamber.com, Accessed March 15, 2026.
[9] Federal Reserve Bank of San Francisco, "Consumer Spending and the Service Sector," February 2026, https://www.frbsf.org, Accessed March 15, 2026.
[10] McKinsey & Company, "The Future of Retail and Hospitality Operations," 2025, https://www.mckinsey.com, Accessed March 15, 2026.
[11] Cornell Hospitality Quarterly, "Operational Efficiency in High-Cost Markets," August 2025, https://journals.sagepub.com/home/cqx, Accessed March 15, 2026.
[12] Berkeley Economic Review, "The Economics of the Modern Taqueria," December 2025, https://econreview.berkeley.edu, Accessed March 15, 2026.