

Prime cost represents the combined total of food and labor expenses. This metric determines operational viability for restaurant businesses in high-cost markets.
For San Francisco operators, prime cost management is critical. Labor rates exceed national averages. Rent pressures are significant. Margin compression is the default operating condition.
Defining Prime Cost
Prime cost consists of two components:
- Cost of Goods Sold (COGS): Total food and beverage inventory costs
- Total Labor Costs: Hourly wages, salaries, payroll taxes, benefits, management compensation
Formula: (Total Labor Costs + COGS) / Total Sales × 100
Industry standard targets range from 55% to 65% of total sales. San Francisco operators should target the lower end of this range.

Calculation Method
Step 1: Calculate COGS
Beginning Inventory + Purchases – Ending Inventory = COGS
Step 2: Calculate Total Labor
Hourly wages + Salaries + Payroll taxes + Benefits + Management compensation = Total Labor
Step 3: Calculate Prime Cost Percentage
(Total Labor + COGS) / Total Sales × 100 = Prime Cost %
Example calculation:
- Weekly labor costs: $8,500
- COGS: $6,200
- Total sales: $24,000
- Prime cost: ($8,500 + $6,200) / $24,000 = 61.25%
This operator has 38.75% remaining for rent, utilities, equipment, marketing, and profit.
Benchmark Targets by Concept
Prime cost targets vary by restaurant type:
Quick Service
- Prime cost: 50-55%
- Labor: 20-25%
- COGS: 25-30%
Full Service
- Prime cost: 56-63%
- Labor: 28-35%
- COGS: 28-32%
Fine Dining
- Prime cost: 60-65%
- Labor: 30-35%
- COGS: 32-38%
San Francisco full-service restaurants should maintain prime costs below 60% to accommodate elevated occupancy expenses. This requires tighter control than operators in lower-cost markets.

San Francisco-Specific Challenges
Labor Cost Pressure
San Francisco minimum wage: $18.07 per hour (2026). Health mandate costs add 4-5% to labor expenses. Payroll taxes exceed other California markets. Competitive labor market drives wage premiums.
High Occupancy Costs
Average restaurant rent: $75-150 per square foot annually. Triple net leases shift additional expenses to tenants. This reduces available margin for food and labor costs.
Value Barbell Effect
Consumer demand concentrates at price extremes. Mid-price concepts experience margin compression. Operators must deliver premium value or exceptional experience to justify pricing.
Prime Cost Control Strategies
1. Demand-Driven Scheduling
Traditional scheduling uses averages and estimates. This creates systematic overstaffing and waste.
Implementation requirements:
- Historical sales data analysis by day part
- External demand factors (events, weather, holidays)
- Real-time sales tracking
- Labor cost monitoring by hour
Benefits:
- 3-7% reduction in labor costs
- Maintained service standards
- Reduced employee idle time
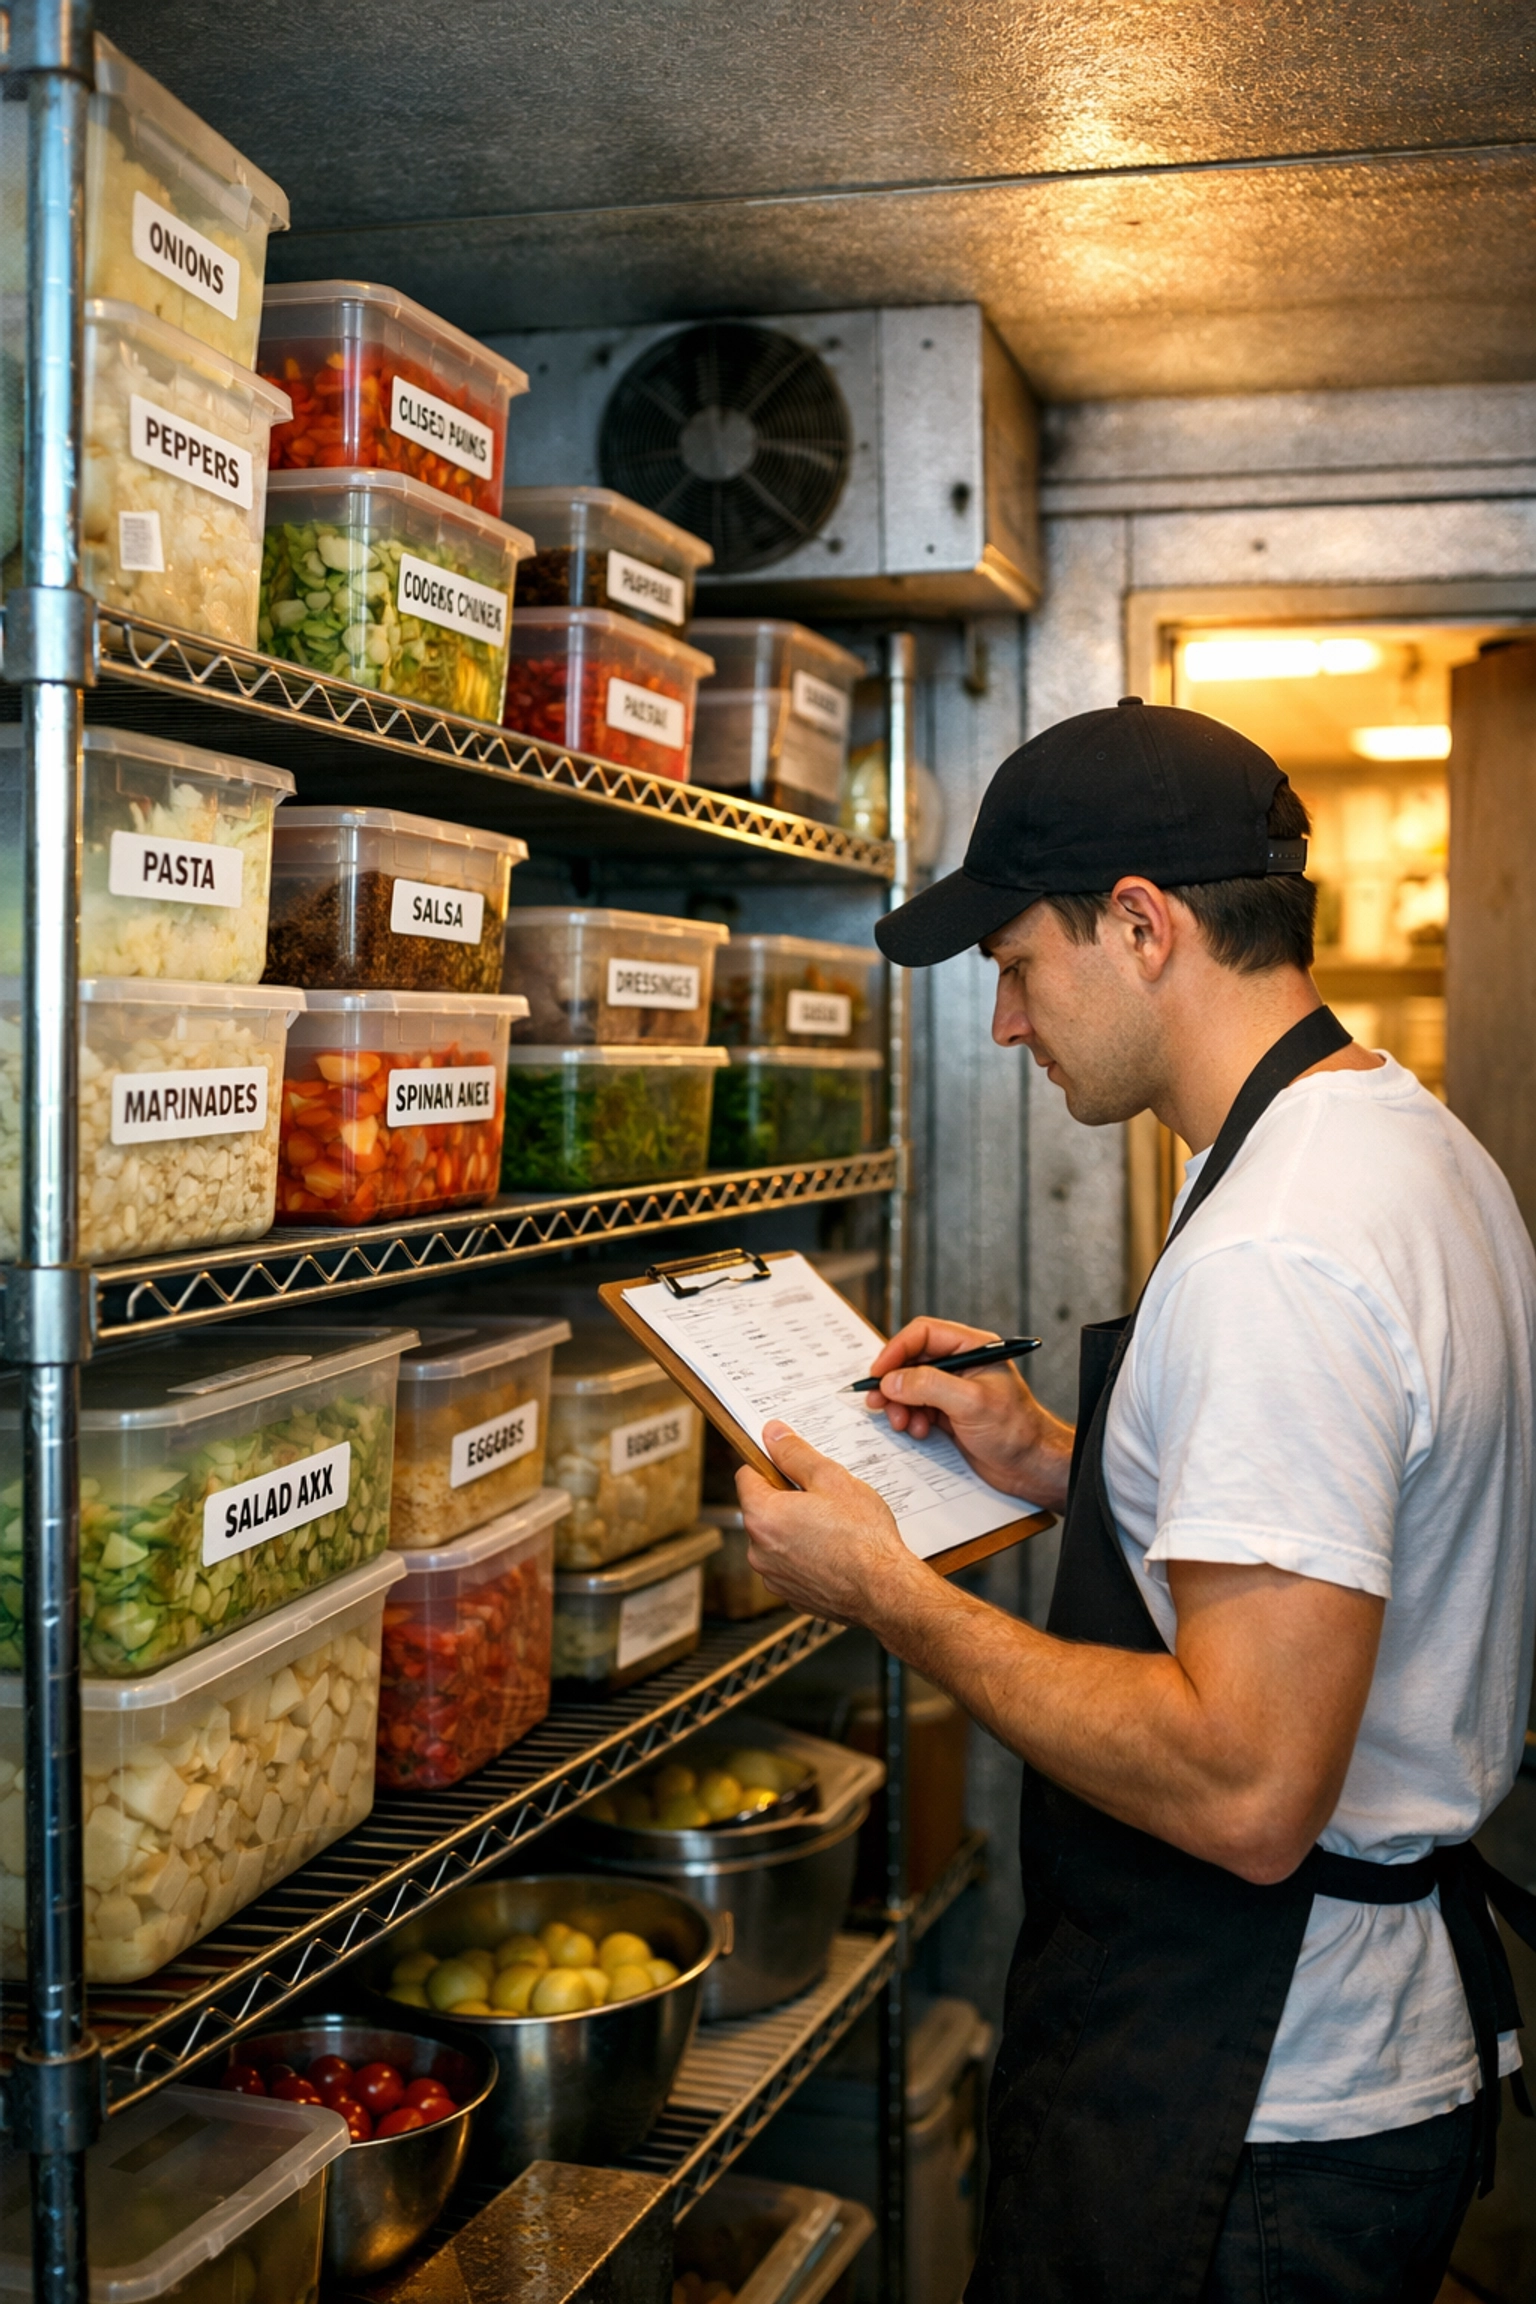
2. Inventory Management Systems
Manual inventory tracking creates data lag and inaccuracy.
Required systems:
- Automated perpetual inventory
- POS integration
- Supplier price tracking
- Waste logging protocols
Target metrics:
- Weekly inventory turnover
- Variance analysis under 2%
- Real-time food cost percentage
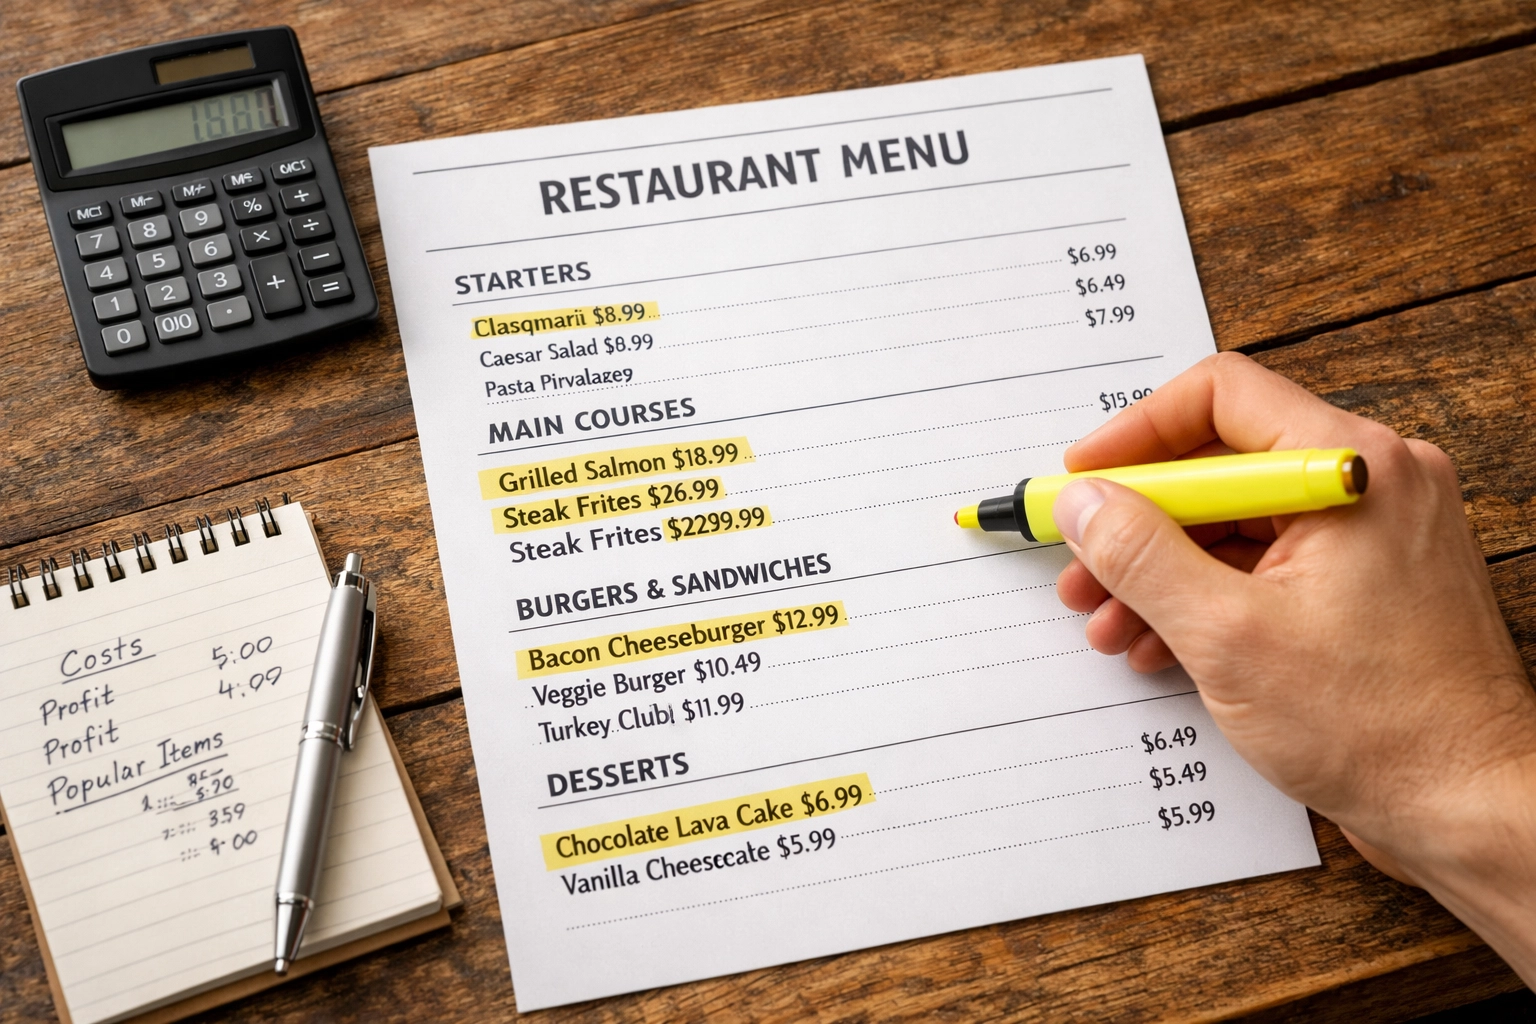
3. Menu Engineering
Menu design directly impacts prime cost performance.
Analysis components:
- Item-level contribution margin
- Popularity index
- Food cost percentage by item
- Labor intensity rating
Actions:
- Promote high-margin items
- Eliminate low-margin, low-popularity items
- Adjust portion sizes based on waste data
- Strategic price positioning
4. Production Planning
Kitchen production should align with forecasted demand.
Requirements:
- Par level systems
- Prep sheets based on sales forecasts
- Batch cooking protocols
- First-in, first-out inventory rotation
Outcomes:
- Reduced food waste
- Lower labor hours
- Improved product consistency
5. Real-Time Data Visibility
Monthly financial statements provide data too late for corrective action.
Implementation:
- Daily prime cost reporting
- Automated variance alerts
- Manager dashboard access
- Week-over-week trending
This enables immediate response to cost deviations.
Common Mistakes to Avoid
Aggressive Labor Cuts
Reducing labor hours without operational redesign degrades service quality. This drives customer attrition and revenue decline. The margin improvement is temporary.
Low-Quality Ingredient Substitution
Switching to inferior products reduces food cost percentage but damages brand reputation. Customer lifetime value decreases exceed short-term savings.
Ignoring Waste
Food waste represents pure profit loss. Operators without waste tracking systems cannot identify root causes or implement solutions.
Average-Based Planning
Using average sales data for scheduling and purchasing creates systematic inefficiency. Demand varies significantly by day, weather, and external events.
Monitoring and Adjustment
Establish weekly review protocols:
Week 1-4: Baseline measurement
- Calculate 4-week average prime cost
- Identify high-variance days
- Document operational patterns
Week 5-8: Initial optimization
- Implement scheduling changes
- Adjust par levels
- Test menu engineering changes
Week 9-12: Refinement
- Measure impact of changes
- Adjust systems based on results
- Set new benchmark targets
Continuous monitoring prevents metric drift and maintains operational discipline.
Technology Integration
Modern restaurant consulting emphasizes integrated technology systems:
- POS systems with labor management
- Inventory management platforms
- Forecasting and scheduling tools
- Financial reporting dashboards
Technology investment delivers ROI through labor efficiency and waste reduction. Manual systems cannot achieve the same precision.

Implementation Priority
Immediate actions (Week 1):
- Calculate current prime cost percentage
- Establish baseline metrics
- Implement daily sales tracking
30-day priorities:
- Deploy demand-based scheduling
- Install waste logging protocols
- Conduct menu profitability analysis
90-day objectives:
- Achieve target prime cost percentage
- Implement automated reporting
- Establish variance response procedures
Restaurant consulting focuses on systematic implementation rather than isolated changes.
Ready to tighten your operations and boost your bottom line? Book a 15-minute intro call with Maury here.