Most restaurant operators watch the wrong numbers. They obsess over food cost percentage or labor cost percentage separately. They wait until month-end to see if they're profitable. By then, it's too late.
Prime cost is the only metric that matters in 2026. It's your food cost plus your labor cost, the two largest controllable expenses in your operation. If you're not tracking it daily, you're operating blind.
Why Prime Cost is the Only Number That Matters in 2026
Your restaurant prime cost represents 55-70% of your total revenue in most full-service operations. Everything else, rent, utilities, marketing, is largely fixed. Prime cost is where you win or lose.
The math is simple: Prime Cost = Total Cost of Goods Sold (COGS) + Total Labor Cost.
If your prime cost exceeds 60-65% of revenue, you're in trouble. You have no margin for error. One slow week, one unexpected repair, and you're underwater.
The problem? Most operators calculate prime cost monthly. They're using a rearview mirror to drive forward. By the time you see a 68% prime cost on your March P&L, you've already lost money for 30 days straight.
The Food Cost Formula: Standard vs. Actual
The food cost formula seems straightforward: (Beginning Inventory + Purchases – Ending Inventory) / Food Sales = Food Cost Percentage.
But there are two versions of this formula, and most operators only use one.
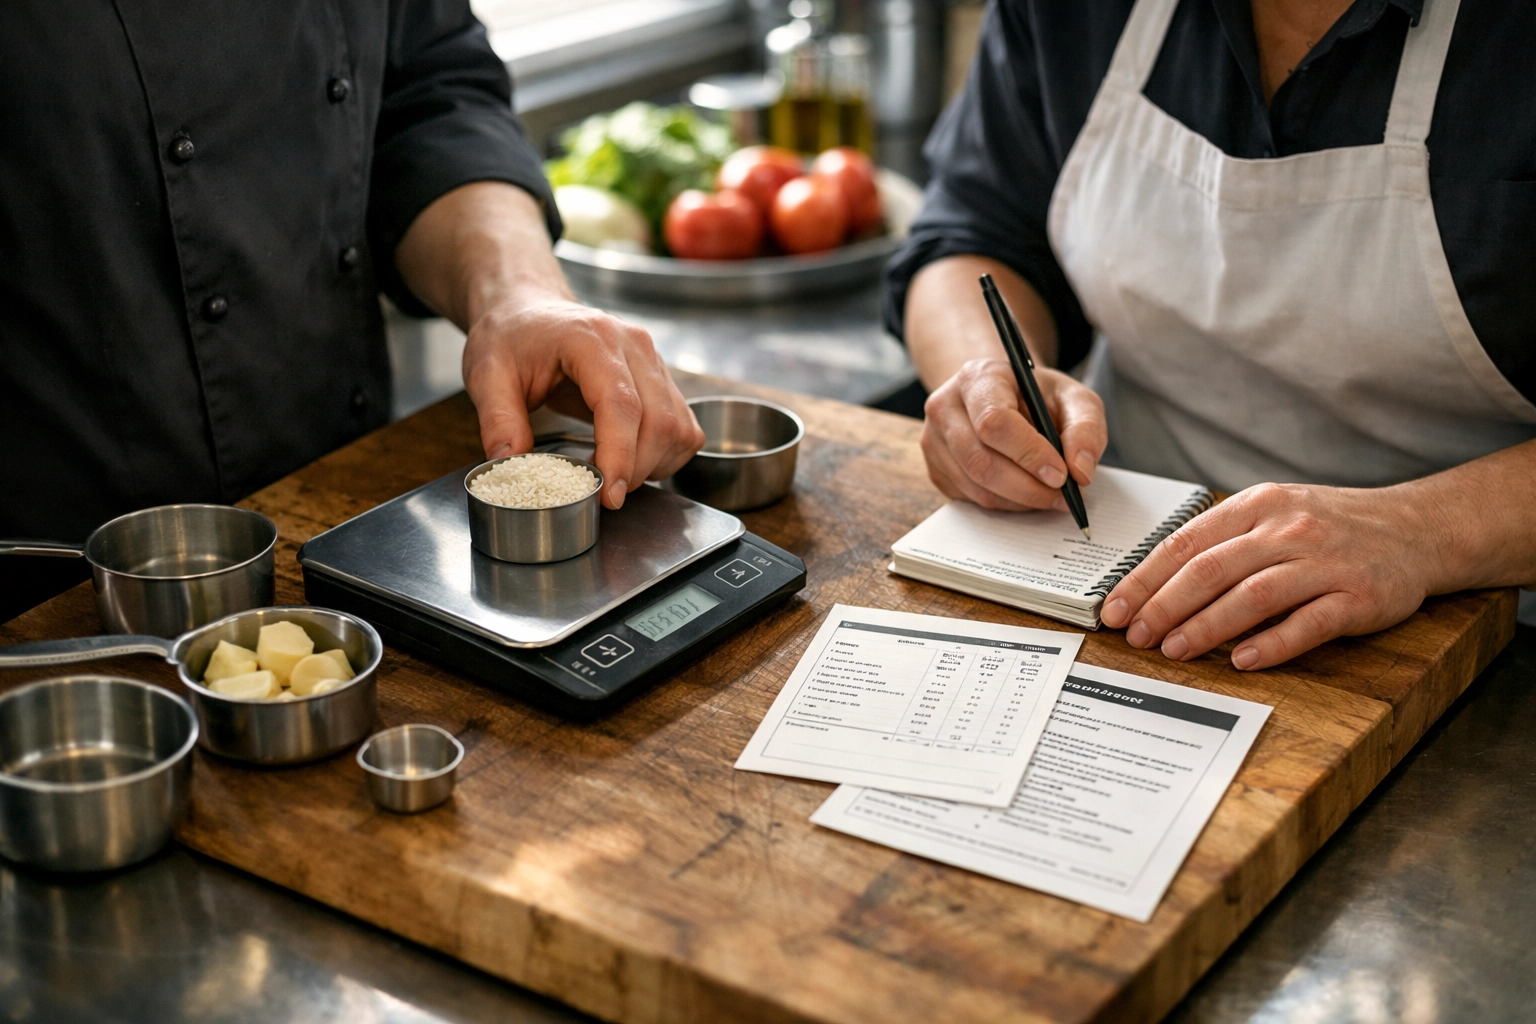
Standard Food Cost is what your food cost should be based on recipes and menu prices. You calculate this by costing every recipe and multiplying by the number of dishes sold. If you sold 100 burgers at a $3.50 recipe cost, your standard food cost is $350.
Actual Food Cost is what you measure with physical inventory. It includes waste, theft, over-portioning, spoilage, and comp meals.
The gap between standard and actual food cost is your variance. A 2-3% variance is normal. A 5-8% variance means you're hemorrhaging money through waste and theft.
Most operators only track actual food cost. They know they're at 32% food cost but have no idea if that's good or bad. Without a standard, you can't identify problems.
The Labor Cost Percentage Trap
Restaurant labor cost percentage follows the same formula: Total Labor Cost / Total Sales = Labor Cost Percentage.
Target labor cost varies by segment. Quick-service operations run 25-30%. Full-service casual dining runs 30-35%. Fine dining can push 35-40%.
But labor cost percentage alone is misleading.
You can hit a 30% labor cost target two ways:
- $30,000 in labor on $100,000 in sales (30%)
- $15,000 in labor on $50,000 in sales (30%)
One scenario is profitable. The other is a disaster because you're not generating enough revenue to cover fixed costs.
This is why operators who focus only on labor percentage make bad decisions. They cut staff to hit their 30% target, service suffers, sales drop, and labor percentage stays exactly the same, but now they're losing money faster.
How to Hit the 60% Prime Cost Target
A 60% prime cost target is standard for full-service restaurants in 2026. Here's how to actually hit it.
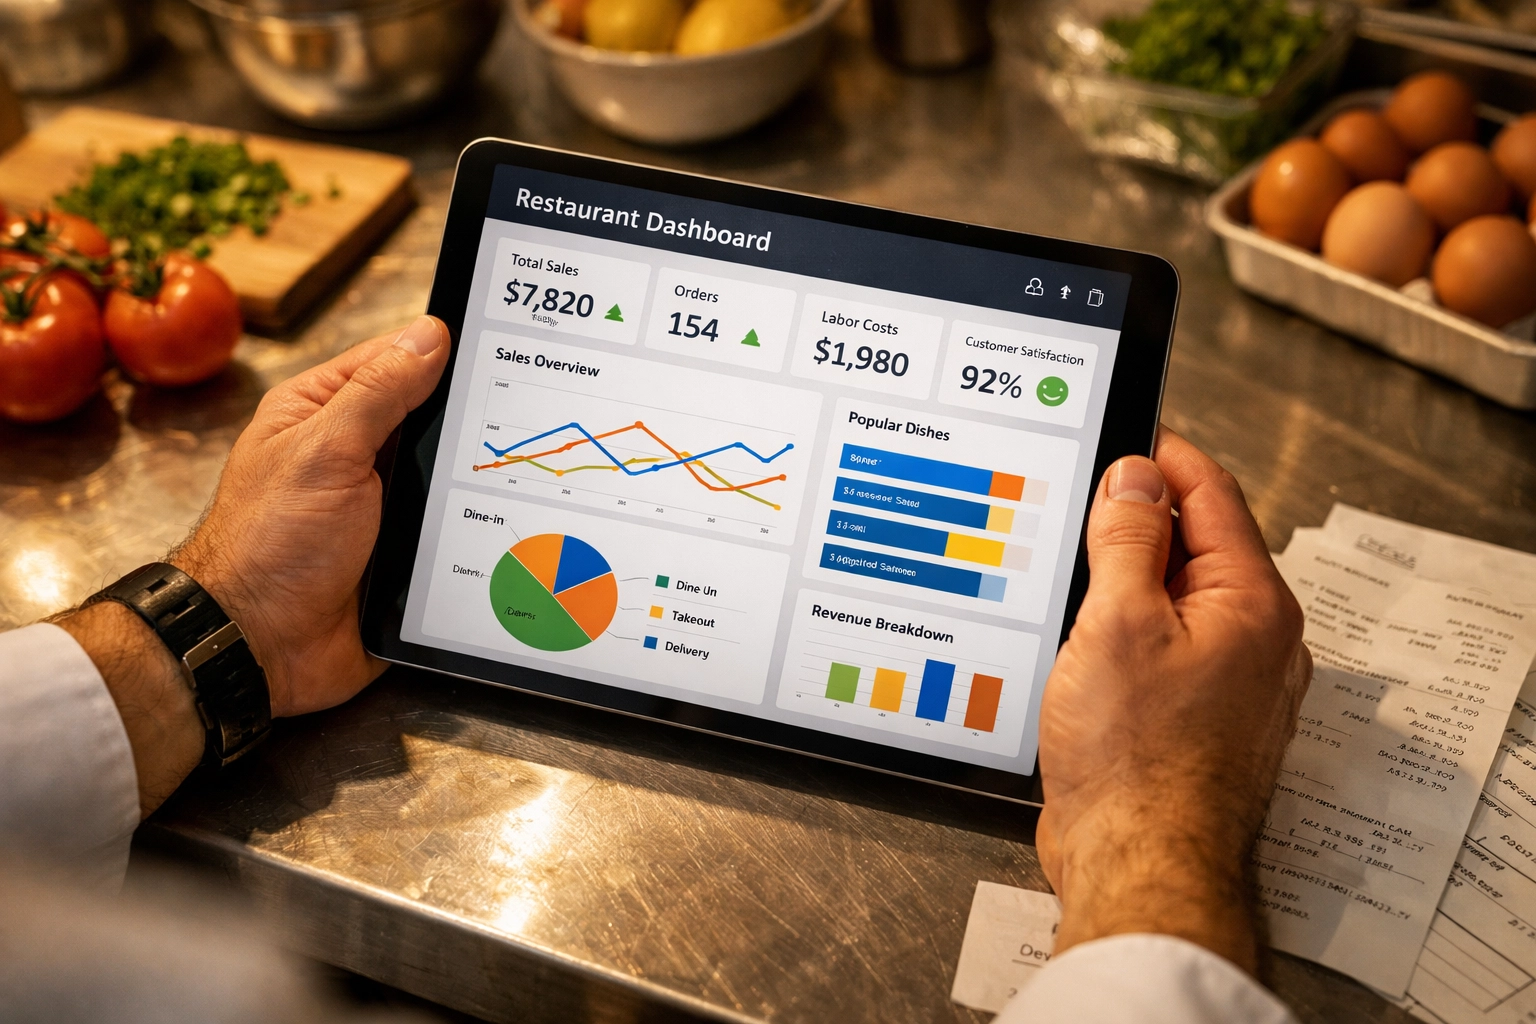
Track Prime Cost Daily
Stop waiting for month-end reports. Your POS system tracks daily sales. Your inventory system should track daily usage (or at minimum, weekly spot-checks). Calculate prime cost every day.
Set variance thresholds: ±1-2% is acceptable. If you're targeting 28% food cost and you hit 31% on Tuesday, investigate immediately. Don't wait until Saturday to discover you've been over-portioning steaks all week.
Run Variance Analysis at the Unit Level
Compare actual food cost to standard food cost weekly. The gap tells you where money is disappearing.
High variance drivers:
- Over-portioning (lack of training or portion control tools)
- Theft (employee meals, missing inventory, vendor fraud)
- Spoilage (poor ordering, bad FIFO rotation, equipment failure)
- Recipe errors (outdated costs, incorrect yields)
Each variance point represents real dollars. A 3% food cost variance on $100,000 in monthly sales is $3,000 in lost profit.
Engineer Your Menu for Margin
Don't cut portions or raise prices across the board. That's lazy management.
Instead, identify your high-margin items and promote them. Use menu placement, server suggestive selling, and daily specials to shift mix toward profitable dishes.
Example: If your salmon dish runs 24% food cost and your pasta runs 18% food cost, moving 10% of your salmon customers to pasta improves your overall food cost by 0.6 points, without changing a single recipe.
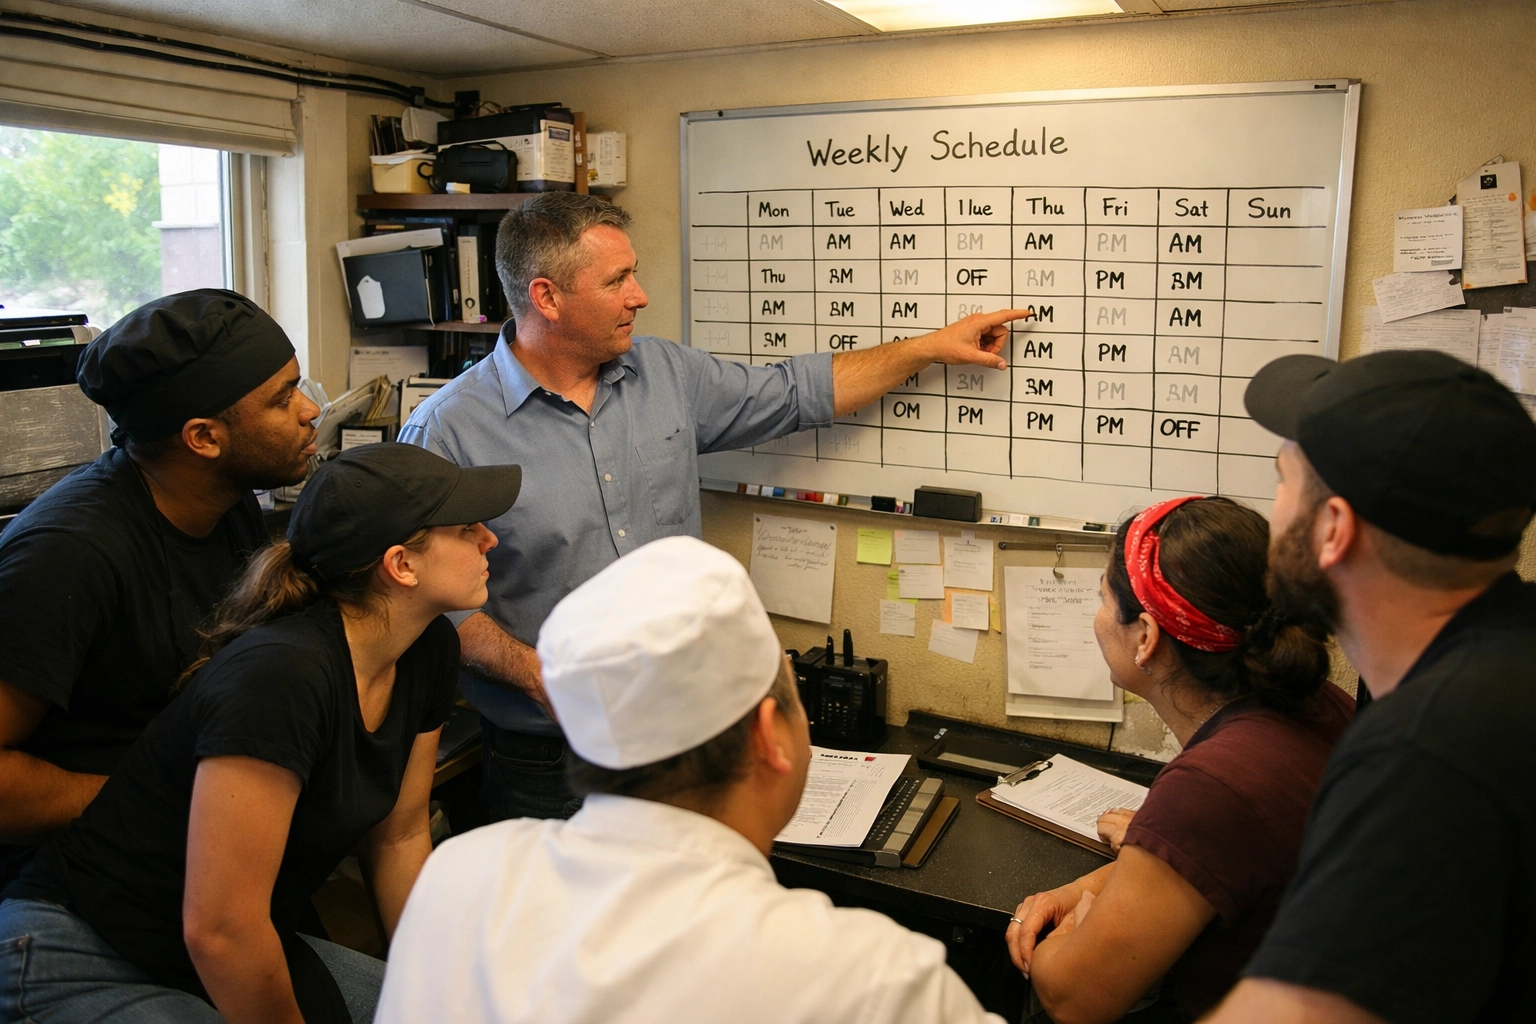
Fix Labor Scheduling
Most operators schedule based on gut feeling or tradition. "We always have three cooks on Friday." That's not a strategy.
Build schedules using historical sales data and traffic patterns. If Tuesdays consistently do $3,500 in sales, you don't need the same staffing as Saturday at $8,000.
Cross-train staff to improve flexibility. A server who can run food or expo reduces the need for dedicated support staff during slow periods.
Track labor as dollars per labor hour, not just percentage. If you're generating $75 in sales per labor hour, that's your productivity metric. Anything below $60 per labor hour in full-service dining means you're overstaffed.
Consolidate Your Technology
Operators using separate systems for POS, inventory, scheduling, and accounting spend hours reconciling data. By the time they have usable information, the week is over.
Integrated platforms that pull data from all sources into a single dashboard allow real-time monitoring. You can check food cost, labor cost, and prime cost from your phone while you're off-site.
The ROI is immediate. Catching a 5% variance one week earlier saves thousands in a single month.
The Real Problem: You're Managing Backward
Traditional restaurant management runs on a monthly cycle. You close the books, review the P&L, identify problems, and promise to fix them next month.
That's managing backward. You're reviewing what already happened instead of controlling what's happening now.
The shift required in 2026 is treating prime cost as a daily operating metric, not a month-end report. Your prime cost on Monday should inform your decisions on Tuesday.
If food cost spiked to 35% yesterday, you investigate today. If labor cost is trending high mid-week, you adjust weekend schedules before the damage compounds.
What a 60% Prime Cost Actually Looks Like
Target breakdown for full-service casual dining:
- Food Cost: 28-32%
- Beverage Cost: 20-25%
- Total COGS: 30-33%
- Labor Cost: 28-32%
- Prime Cost: 58-65%
If you're running a 33% food cost and 32% labor cost, you're at 65% prime cost. That leaves 35% to cover rent, utilities, marketing, insurance, and profit. It's tight but workable.
If you're at 35% food cost and 35% labor cost, you're at 70% prime cost. You have 30% left for everything else. Unless your rent is under 6% and you have zero debt service, you're not profitable.
A three-point improvement in prime cost: from 68% to 65%: is the difference between breaking even and making a 10% net profit.
How MFRCG Approaches Prime Cost
We don't start with food cost or labor cost. We start with your P&L and work backward.
First, we identify your target net profit. Then we calculate how much prime cost you can afford to hit that target. Then we build the systems to keep you there.
Most operators discover they're 3-5 points over their prime cost target. The fix isn't cutting portions or slashing staff. It's implementing daily reporting, fixing variance gaps, and engineering your menu for profitability.
The consulting process includes:
- Complete P&L review and prime cost analysis
- Recipe costing and menu engineering
- Labor productivity audit and scheduling optimization
- Technology assessment and integration recommendations
- 90-day action plan with weekly benchmarks
If you're not tracking prime cost daily, you're guessing. If you're tracking it but not hitting your targets, you need a plan.
Contact MFRCG for a P&L review. We'll show you exactly where your prime cost is failing and how to fix it.