
Story researched by MFRCG Staff
Based on the analysis of 2026 Bay Area dining trends.
The Sticker Shock Breaking Point
Walk into any San Francisco restaurant right now and you'll feel it, the hesitation. Diners scan the menu, pause at the prices, and recalibrate their entire evening. A burger that was $16 in 2023 is now $24. That pasta dish? $32. The neighborhood spot you used to hit twice a week? Now it's a special-occasion venue.
This is the 2026 Bay Area price war, and it's not a war anyone can win by simply jacking up prices. California's minimum wage has climbed to $16.90 per hour [California Department of Industrial Relations (DIR)[1]], and fast food chains have pushed menu prices up about 14.5% since the $20 wage law took effect [KTLA[2]]. Independent restaurants are stuck in the middle: raise prices too high and you lose your regulars; keep them low and you bleed money every service.
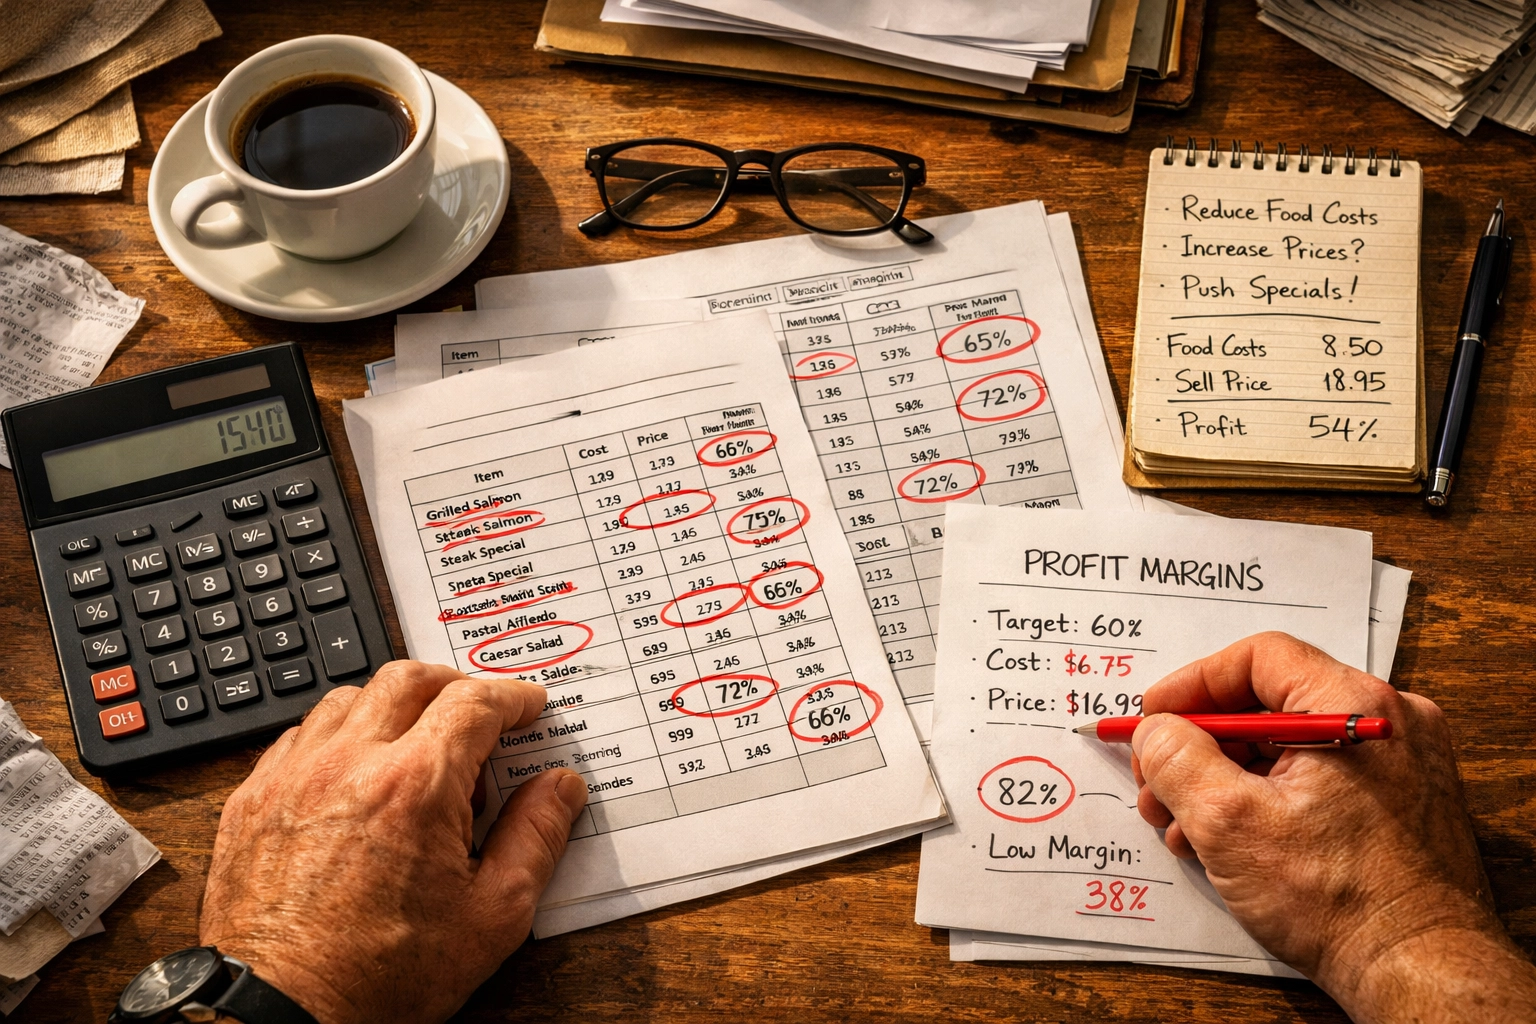
The math is brutal. With food costs running 32-35% and labor eating another 35-38% of revenue, your prime cost is already sitting at 67-73%. Add rent, utilities, insurance, and the cost of just keeping the doors open, and you're looking at single-digit net margins, if you're lucky.
Here's what most operators are missing: the answer isn't in your P&L. It's in your menu. Menu engineering isn't about fancy design or clever descriptions. It's about understanding which dishes make you money, which ones lose you money, and how to guide diners toward the profitable ones without them ever noticing. In 2026, it's not optional anymore. It's survival.
What Menu Engineering Actually Means
Menu engineering is the systematic analysis of every dish based on two metrics: profitability (gross profit per item) and popularity (sales volume). This framework was developed in the 1980s, but the 2026 version needs updates for California's labor reality [American Hotel & Lodging Educational Institute (AHLEI)[4]].
Every dish on your menu falls into one of four categories:
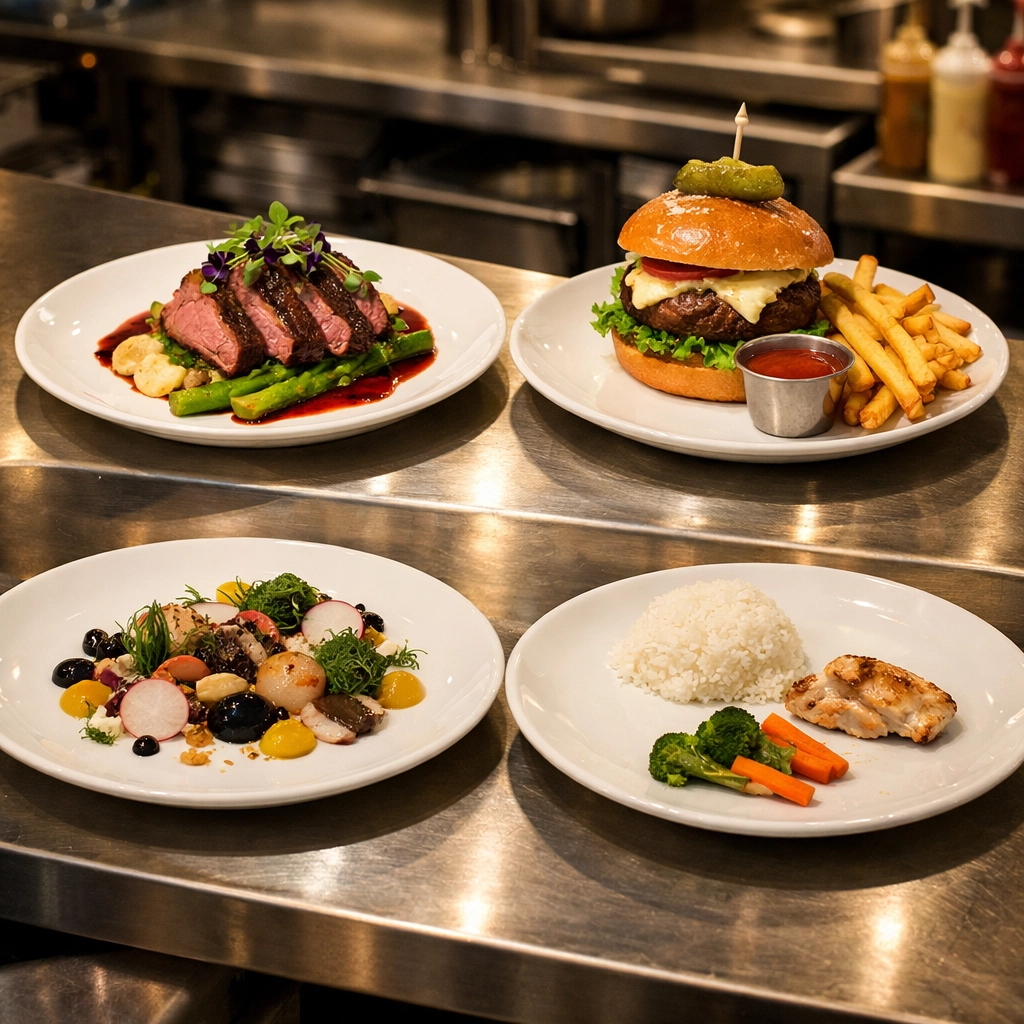
Stars are your high-profit, high-popularity dishes. These are the items customers love and that pad your bottom line. A well-engineered menu pushes these hard.
Plowhorses are popular but low-margin. They bring traffic but don't make you rich. Think of the classic burger everyone orders but costs you $8.50 to make when you're selling it for $18.
Puzzles are high-margin but low-popularity. These are your chef's passion projects, the dishes with expensive ingredients that only a few tables order each night.
Dogs are the worst of both worlds: low-profit and low-popularity. They take up menu real estate, confuse your kitchen, and cost you money every time someone orders one.
The traditional menu engineering model used a 70% food cost threshold. In 2026 Bay Area restaurants, with labor costs spiking, we're looking at prime cost (food + labor) as the real metric. A dish might have a 28% food cost but require 12 minutes of line-cook labor. At $22/hour with burden, that's another $4.40 in labor. Suddenly your "profitable" dish isn't.
The 2026 Menu Engineering Matrix
Here's how to classify your dishes using the updated framework that accounts for the $16.90 minimum wage reality:
| Category | Profitability | Popularity | Prime Cost | What to Do |
|---|---|---|---|---|
| Stars | High (55%+ contrib. margin) | High (>10% of mix) | <60% | Feature prominently, upsell, protect recipe |
| Plowhorses | Low (<55% contrib. margin) | High (>10% of mix) | 65-70% | Increase price slightly, reduce portion, or simplify prep |
| Puzzles | High (55%+ contrib. margin) | Low (<10% of mix) | <60% | Reposition, rename, or move to specials board |
| Dogs | Low (<55% contrib. margin) | Low (<10% of mix) | >70% | Cut immediately or completely re-engineer |
The contribution margin is calculated as: (Menu Price – Food Cost – Direct Labor Cost) / Menu Price
In San Francisco, where line cook pay commonly lands in the low-to-mid $20s per hour, labor time per dish becomes as critical as ingredient cost [Chef’s Pencil[5]]. A braise that takes three hours of passive oven time is fine. A dish that requires 15 minutes of active plating during a rush is a margin killer.
Why Raising Prices Alone Is a Death Sentence
The Bay Area dining scene has hit a psychological ceiling. Customers expect high prices, but they also expect value. When a neighborhood trattoria charges $38 for pasta, diners start comparing it to high-end restaurants with Michelin pedigree. You're no longer competing with other casual spots, you're competing with the fine dining tier.
Restaurant traffic in California dropped 3.5% in late 2025, even as prices climbed [Black Box Intelligence[3]]. That's the danger zone: fewer customers paying higher prices doesn't fix your math if volume falls faster than your price increases can compensate.
Oakland restaurants are seeing this play out in real time. A popular taqueria raised its burrito from $12 to $16.50 over 18 months. Volume dropped 22%. They made slightly more revenue per item but lost overall margin because fixed costs stayed constant while customer visits plummeted.
The smarter play is strategic repricing guided by menu engineering data. You don't raise prices across the board. You raise prices on Plowhorses (they'll keep selling), you hold or slightly reduce prices on Stars (to drive volume), you reposition Puzzles (to convert them into Stars), and you cut Dogs entirely.
The Smart Critic: Is This Just Manipulation?
Let's address the elephant in the dining room: Is menu engineering manipulative?
Critics argue that psychological pricing tactics, like placing high-margin items in the "sweet spot" of a menu, using decoy pricing, or removing dollar signs, are designed to trick diners into spending more than they intended. In an era of $18 avocado toast and $42 chicken entrees, is it ethical to engineer menus for maximum profitability?
Here's the counterargument: Menu engineering is transparency, not manipulation. When you understand your costs, you can price fairly. You're not inflating prices arbitrarily, you're ensuring that every dish covers its true cost, including the labor to prep, cook, and plate it. Restaurants that don't engineer menus often under-price labor-intensive dishes and over-price simple ones, which is actually less fair to customers.
The alternative to menu engineering is closing your doors. Independent restaurants often operate on slim net margins (commonly single digits, often cited in the 2%–6% range). In 2026, with California's cost structure, that's nearly impossible without disciplined menu design [Lightspeed[6]]. If a restaurant uses behavioral economics to guide diners toward dishes that keep the business viable, that's not manipulation, that's survival.
The real manipulation would be cutting quality, shrinking portions without notice, or staying open while slowly going bankrupt and stiffing vendors and staff when you eventually close. Menu engineering, done right, keeps quality high and doors open.
The 10-Step Menu Re-Engineering Process
Here's how to re-engineer your menu for immediate 3-5% margin growth:
1. Run a Full Menu Mix Report
Pull 90 days of sales data. Calculate total units sold and revenue per dish. Identify your top 20% of items by volume, these are your Plowhorses and Stars.
2. Calculate True Prime Cost Per Dish
Don't just use food cost. Add direct labor. If your line cook makes $24/hour and a dish takes 8 minutes of active time, that's $3.20 in labor. Add prep labor (e.g., 30 minutes of prep yielding 10 portions = $1.80 per portion at $18/hour). Your true prime cost is food + direct labor.
3. Classify Every Dish Into the Matrix
Use the table above. Be honest about contribution margins. A 55% contribution margin means the dish is delivering $11 of profit on a $20 menu price after covering food and direct labor.
4. Cut All Dogs Immediately
If a dish has low profit and low popularity, it's dead weight. Cutting three Dogs frees up mental space for your kitchen, reduces ordering complexity, and eliminates margin drains. Replace them with simplified versions of your Stars.
5. Reprice Plowhorses by $1-3
Your popular items can absorb small price increases. If your burger is a Plowhorse, raising it from $18 to $20 won't crater demand, but it will add $2 to your contribution margin. On 200 burgers per week, that's $400 in found money.
6. Reposition Puzzles
High-margin, low-popularity dishes need better placement and description. Move them to the top-right of your menu (the "sweet spot" where eyes land first). Add a short story: "Chef's Favorite" or "Guest Favorite Since 2019." Test a $2 price reduction to drive trial.
7. Feature Stars Prominently
Use boxes, bold text, or icons. Train servers to recommend Stars when asked. Create combo deals around Stars (e.g., pair your high-margin salmon with a high-margin side for $4 less than ordering separately).
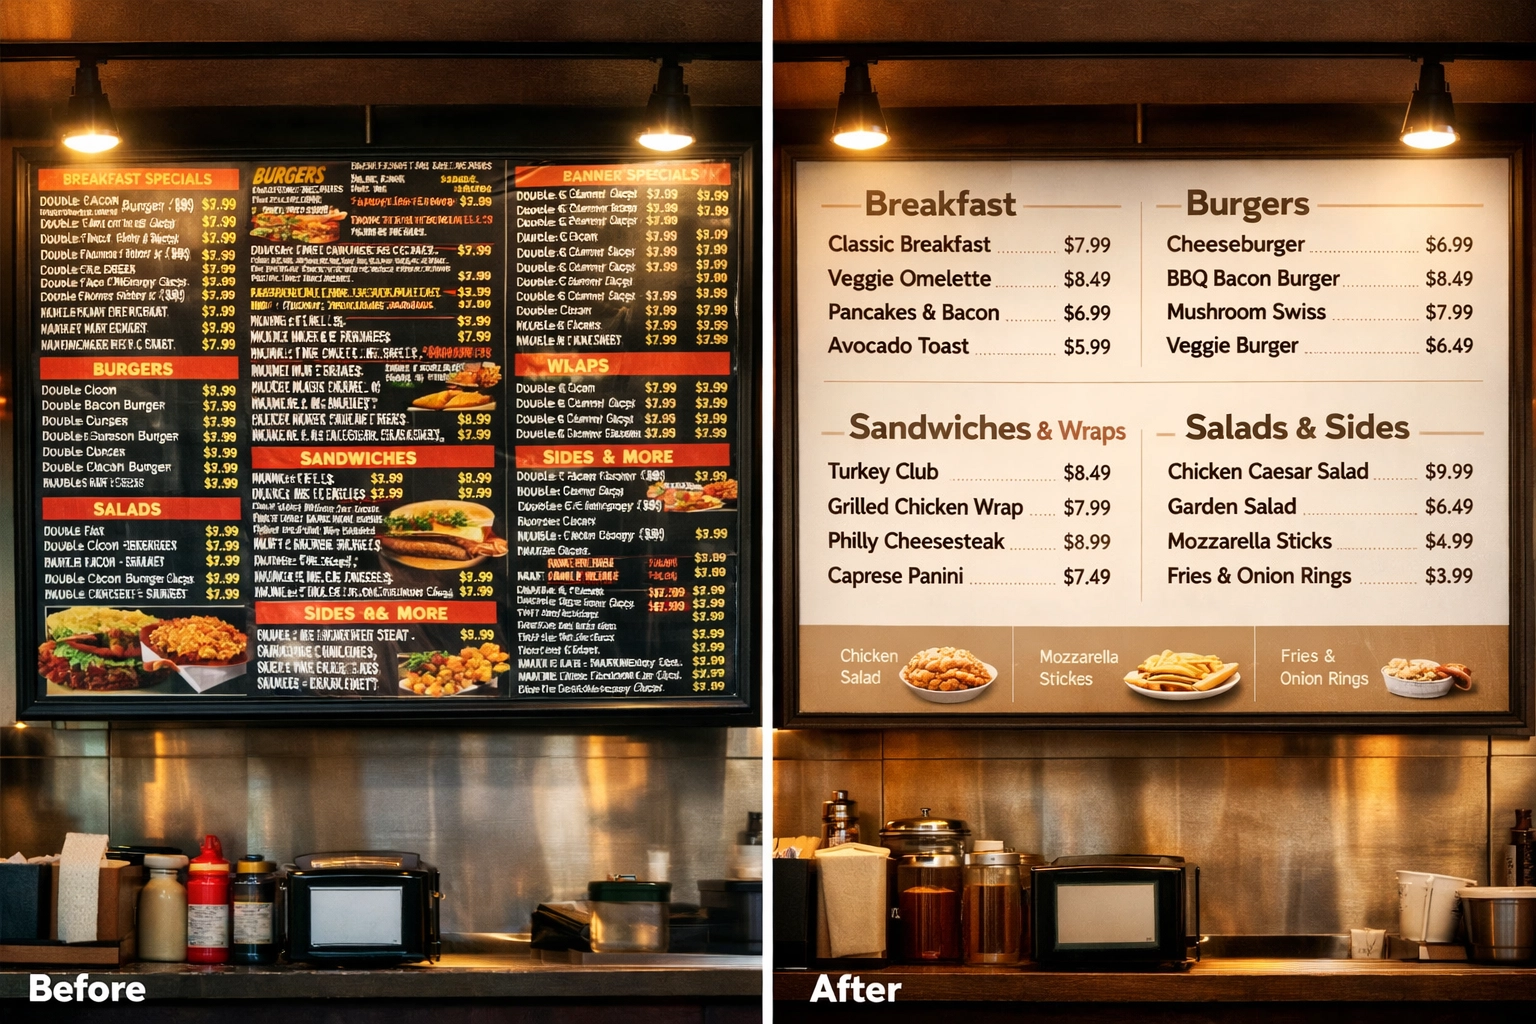
8. Reduce Menu Size by 20-30%
Fewer items mean tighter inventory, less waste, faster ticket times, and lower labor costs. Aim for 18-24 entrees maximum. Your kitchen will thank you, and your food cost will drop 2-3% from waste reduction alone.
9. Test Portion Sizes on Plowhorses
If you can't raise prices without backlash, reduce portions slightly. A 10% portion reduction on a $16 dish with a $5.50 food cost saves $0.55 per plate. Most diners won't notice if plating is smart.
10. Review and Adjust Quarterly
Menu engineering isn't one-and-done. Re-run your analysis every 90 days. Seasonality, supplier costs, and customer preferences shift. A Star in winter might become a Puzzle in summer.
Real Bay Area Case Study
A 60-seat Oakland restaurant implemented menu engineering in late 2025. They cut 8 Dogs, repriced 6 Plowhorses by an average of $2.25, repositioned 3 Puzzles, and doubled down on 4 Stars. Within 90 days:
- Food cost dropped from 34% to 31%
- Labor cost per plate dropped 8% due to simplified kitchen flow
- Average check increased $3.80
- Customer complaints stayed flat (no backlash on pricing)
- Net margin grew from 4.1% to 7.3%
That 3.2% margin swing on $1.2M in annual revenue meant an extra $38,400 in profit, the difference between breaking even and actually paying ownership.
What Oakland and SF Operators Miss
Most Bay Area restaurants treat their menu as a creative document, not a financial one. Chefs add dishes because they're excited about a new technique or ingredient. Owners keep "legacy" items because they've always been there. Nobody runs the numbers.
The result? Menus bloated with 40+ items, half of which lose money. Kitchens stretched thin trying to execute too many recipes. Inventory waste spiking because you're stocking ingredients for low-volume Puzzles and Dogs.
San Francisco restaurant consulting experts see this pattern constantly: operators focus on top-line revenue ("We did $45K this week!") and ignore the margin reality. A $45K week with a 68% prime cost nets you $14,400. A $42K week with a 62% prime cost nets you $15,960. Lower revenue, higher profit.
Menu engineering flips the script. You design for margin first, volume second.
FAQ
How often should I update my menu pricing?
Review menu engineering data quarterly, but only make pricing changes 1-2 times per year unless costs spike dramatically. Too-frequent changes frustrate regulars.
Can I do this without expensive POS reports?
Yes. Pull a simple sales report showing item name, quantity sold, and revenue. Manually calculate food cost and labor cost using your recipes and prep times. It takes a few hours but delivers the same insights.
What if my "signature dish" is a Dog?
This is common. If a dish has sentimental or brand value but low margin, treat it as a loss leader, but re-engineer it. Can you simplify the recipe? Reduce the portion? Raise the price by $3-4 and see if demand holds?
Should I tell customers I'm engineering my menu?
No. The goal is to guide choices subtly. Customers care about value and quality, not your backend margin strategy. Show them great food at fair prices.
How do I calculate labor cost per dish?
Time your line cooks. If a dish takes 6 minutes of active cook time at $24/hour, that's $2.40 in direct labor. Add prep time (e.g., 20 minutes per batch of 10 = $0.60 per portion at $18/hour). Total labor cost: $3 per dish.
What if my entire menu is Plowhorses?
You're in trouble. This means customers love your food but you're under-pricing everything. Start with 5-10% across-the-board price increases on everything except your true Stars, then re-analyze in 60 days.
Survive 2026 With Smarter Margins
The Bay Area price war won't be won by whoever charges the most or the least. It will be won by operators who understand their numbers, engineer their menus for profitability, and guide diners toward the dishes that keep the lights on.
Menu engineering isn't about tricking anyone. It's about running a sustainable business in the most expensive restaurant market in the country. Your customers want you to stay open. Your staff needs you to stay open. The only way to do that in 2026 is to treat your menu like the financial tool it is.
Ready to re-engineer your menu and add 3-5% to your bottom line? McFadden Finch Restaurant Consulting Group specializes in menu engineering and prime cost optimization for Bay Area restaurants. We'll analyze your current menu, identify your Dogs and Stars, and build a roadmap for immediate margin growth.
Call us at (510) 973-2410 or visit mcfadden-finch-group.com/contact to schedule your Discovery Call.
About McFadden Finch Restaurant Consulting Group
We help Bay Area restaurant owners build profitable, sustainable operations through menu engineering, kitchen design, operational turnarounds, and feasibility studies. Whether you're launching a new concept or fixing an existing one, we bring 20+ years of hospitality expertise to the table. From San Francisco to Oakland to Napa, we understand California's unique cost pressures: and we know how to beat them.
Services: Restaurant Turnaround | Operations Consulting | Kitchen Design | Feasibility Studies
Contact: (510) 973-2410 | Book Your Discovery Call
Sources
[1] California Department of Industrial Relations (DIR), “Minimum Wage,” State of California, n.d., https://www.dir.ca.gov/dlse/minimum_wage.htm, Accessed February 7, 2026.
[2] Marc Sternfield, “How fast food prices in California have changed since the minimum wage hike,” KTLA, October 7, 2024, https://ktla.com/news/california/how-fast-food-prices-in-california-changed-after-the-minimum-wage-hike/, Accessed February 7, 2026.
[3] Black Box Intelligence, “Restaurant Industry in Review: Trends from September 2025,” Black Box Intelligence, n.d., https://blackboxintelligence.com/blog/restaurant-industry-in-review-trends-from-september-2025/, Accessed February 7, 2026.
[4] American Hotel & Lodging Educational Institute (AHLEI), “The Power of Menu Engineering – Part One,” AHLEI / ServSafe Brands, n.d., https://ahlei.servsafebrands.com/resources-overview/news-and-insights/the-power-of-menu-engineering-part-one, Accessed February 7, 2026.
[5] Corina Onet, “How Much Do Chefs and Line Cooks Make in 2025?,” Chef’s Pencil, May 30, 2025, https://www.chefspencil.com/chef-line-cook-salaries-local-data/, Accessed February 7, 2026.
[6] Lightspeed, “The Complete Guide to Restaurant Profit Margins,” Lightspeed, April 9, 2025, https://www.lightspeedhq.com/blog/complete-guide-to-restaurant-profit-margins/, Accessed February 7, 2026.