A restaurant owner in Oakland sits at a small corner table after a long Friday shift. The dining room is finally quiet, but their mind is racing. They’ve done $35,000 in sales this week: a personal best. The place was packed, the reviews are glowing, and the staff is exhausted. But as they look at the bank balance, something doesn't add up. After paying the meat distributor, the wine vendor, the landlord, and the payroll taxes, there is barely enough left to cover their own rent, let alone reinvest in the business.
This is the reality of "the grind." Many operators believe that more sales solve every problem. But in the restaurant business, volume without efficiency is just a faster way to go broke. The industry talks about thin margins as if they are a badge of honor or an unavoidable curse, but they don't have to be.
This post answers why restaurant profit margins are so low and how successful operators push past the 5% average to hit double digits. You will learn:
- The breakdown of the "Big Three" costs that eat your profit.
- How menu engineering and operational tightening act as immediate margin boosters.
- The critical role of feasibility studies in preventing financial "bleed" before it starts.
The 5% Ceiling: Why Most Restaurants Struggle
The standard narrative in the hospitality world is that restaurants operate on a razor-thin net profit margin of 3% to 6% (National Restaurant Association) [1]. On a $100 ticket, the owner is lucky to keep $5 after everyone else is paid. This leaves zero room for error. One broken walk-in freezer or a sudden spike in egg prices can turn a profitable month into a deficit.
However, high performers: the top 10% of operators: routinely hit net margins of 10% to 15% (Restaurant365) [2]. The difference between a 3% margin and a 12% margin isn't just "working harder." It is the result of systematic operational tightening and a refusal to accept industry averages as a ceiling. At McFadden Finch Restaurant Consulting Group, we see the same "margin killers" repeatedly: unmanaged waste, bloated labor, and pricing based on "vibes" rather than data.

Understanding the "Big Three": Where the Money Goes
To improve restaurant profit margins, you have to understand the cost stack. Most independent restaurants lose their grip on profit because they treat their P&L like a monthly surprise rather than a weekly steering wheel.
- COGS (Cost of Goods Sold): This typically sits between 28% and 35% of revenue (Toast) [3]. If your food cost is 35% and you aren't a high-volume steakhouse, you are likely suffering from theft, spoilage, or over-portioning.
- Labor Costs: This is the most volatile expense. Between front-of-house, back-of-house, and payroll taxes, labor usually consumes 25% to 35% of every dollar (U.S. Bureau of Labor Statistics) [4].
- Overhead/Occupancy: Rent, utilities, and insurance should ideally stay under 10%. When rent starts creeping toward 15% of sales, the business model becomes fundamentally unstable (Forbes) [5].
When you add these up, you hit the "Prime Cost": the sum of COGS and Labor. If your prime cost is over 60%, your net profit is in danger. High-performing restaurants aim for a prime cost of 55% or lower.
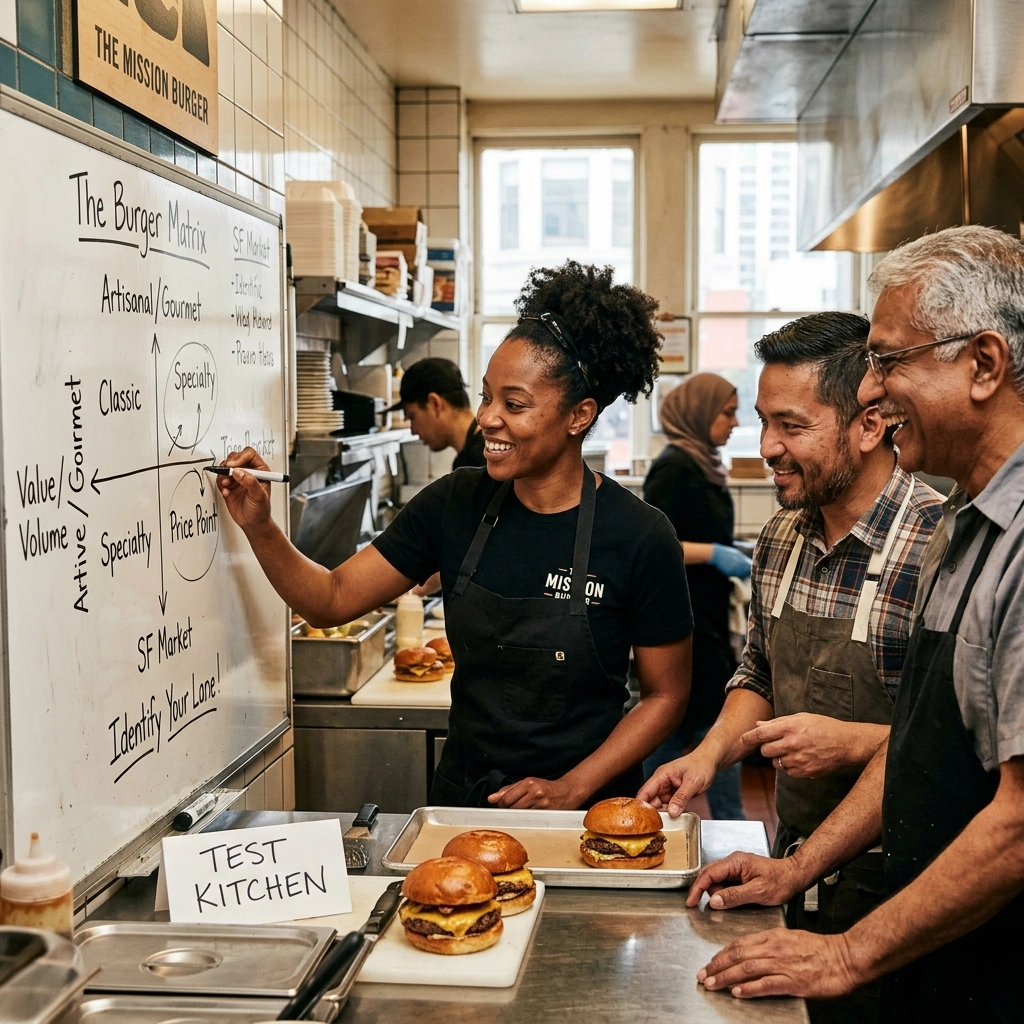
Menu Engineering: Profit by Design
Many owners view their menu as a list of food they like to cook. We view it as a financial roadmap. To beat the 5% average, you must use menu engineering to move guests toward high-margin items.
Items should be categorized into four groups:
- Stars: High popularity, high profit. These are your anchors.
- Plowhorses: High popularity, low profit. You need to adjust the portion size or raise the price.
- Puzzles: Low popularity, high profit. These need better placement on the menu or a verbal "push" from servers.
- Dogs: Low popularity, low profit. Cut them immediately.
By simplifying the menu and rationalizing SKUs (using the same ingredients across multiple dishes), you reduce waste and increase your purchasing power with vendors like UNFI (UNFI) [6]. For more on how to dial in these specifics, our Operations Consulting services focus specifically on these levers.
The Silent Margin Killer: Waste and Over-Portioning
Waste isn't just what goes in the trash at the end of the night; it's what never makes it to the plate in a way that generates revenue. Over-portioning is a primary culprit. If a cook puts an extra half-ounce of cheese on every taco in a high-volume spot, that "small" gesture can cost a restaurant $10,000 a year in lost profit (Cornell University) [7].
Operational tightening means implementing scales, portion scoops, and recipe cards. It isn't about being stingy; it's about consistency. When a guest receives the same portion every time, it builds trust. When the owner ensures that portion matches the cost model, it builds a business. Our Quality Assurance programs are designed to catch these leaks before they drain the bank account.
Labor Efficiency and Smart Scheduling
Labor is often treated as a fixed cost, but it is actually the most controllable lever an operator has. Many restaurants schedule based on habit: "We always have three servers on Tuesdays": rather than historical sales data.
To beat the 5% margin, you must schedule to the "revenue per labor hour." If you are overstaffed during the 2:00 PM to 4:00 PM lull, those idle wages are eating the profit from the lunch rush. Cross-training staff to handle multiple roles allows for a leaner, more agile team that can scale up or down based on actual floor volume (Restaurant Business Online) [8].
The Data: Profit Margins by Concept
Not all restaurant models are created equal. Understanding where you sit in the market helps set realistic targets.
| Restaurant Concept | Average Net Profit Margin | High Performer Target |
|---|---|---|
| Full-Service (Casual) | 3% – 5% | 10% – 12% |
| Fine Dining | 4% – 7% | 13% – 15% |
| Fast Casual / QSR | 6% – 9% | 15% – 20% |
| Ghost Kitchen | 10% – 20% | 25%+ |
| Food Truck | 6% – 10% | 15%+ |
Note: Data compiled from industry benchmarks (Lightspeed, DoorDash, and NRA) [1, 9, 10].
Why Feasibility Studies Matter
At McFadden Finch Restaurant Consulting Group, we often tell clients that the best way to fix a margin is to never break it in the first place. This is where Feasibility Studies come in.
Before a single brick is laid or a lease is signed, you need to know if the numbers work. Can this neighborhood support a $28 pasta dish? Is the kitchen layout efficient enough to run with only two cooks? A feasibility study looks at the local market, labor availability, and projected occupancy costs to determine if the concept is a "Star" or a "Dog" before you invest your life savings.

Case Example: The 7% Shift
Consider a mid-sized bistro in the East Bay. They were doing $1.2 million in annual sales but only seeing a 4% net profit ($48,000). The owner was exhausted and considering closing.
We performed an operational audit and found three major issues:
- The "Plowhorse" burger was being over-portioned by 15%.
- They were overstaffed by one person during the weekday lunch period.
- They had 12 low-selling appetizers that required expensive, specialized prep.
By tightening the portions, adjusting the schedule based on hourly sales, and cutting the "Dogs" from the menu, we reduced COGS by 3% and Labor by 4%. Total sales stayed exactly the same, but the net profit margin jumped to 11%. That 7% shift increased the owner's take-home pay from $48,000 to $132,000. That is the power of operational tightening.
Timeline: The Road to a 10% Margin
| Phase | Milestone | Action Item | Source |
|---|---|---|---|
| Week 1 | Financial Audit | Detailed review of P&L and Prime Costs. | [11] |
| Week 2 | Menu Engineering | Categorize items into Stars, Plowhorses, Puzzles, and Dogs. | [12] |
| Week 3 | Portion Control | Implementation of scales and recipe cards for BOH. | [7] |
| Week 4 | Labor Mapping | Aligning staff schedules to hourly sales forecasts. | [8] |
| Month 2 | Vendor Review | Renegotiating contracts or consolidating suppliers. | [6] |
| Month 3 | Tech Integration | Upgrading POS for better inventory tracking. | [13] |
| Month 4 | Channel Expansion | Adding high-margin catering or private events. | [14] |
| Month 6 | Full Review | Evaluating net margin growth and adjusting targets. | [2] |
What Smart Critics Argue
Some industry veterans argue that "tightening the screws" too much kills the soul of a restaurant. They claim that guests can feel when a portion is weighed or when a kitchen is running "too lean."
The Response: Precision is not the enemy of hospitality. In fact, inconsistency is the true "soul-killer." A guest who gets a massive steak one night and a smaller one the next feels cheated. Furthermore, a restaurant that goes out of business because it couldn't manage its margins provides zero hospitality to the community. Profitability provides the stability needed to pay staff well and maintain high standards.
Key Takeaways
- The 5% average is a baseline, not a rule. High performers aim for 10-15% net profit.
- Prime Cost is king. Keep COGS and Labor combined under 60%.
- Menu engineering is a lever. Focus on "Stars" and fix or cut "Plowhorses" and "Dogs."
- Feasibility work saves fortunes. Vet the business model before you sign the lease.
- Waste is invisible profit. Use portion control and SKU rationalization to stop the leak.
- Schedule by the numbers. Don't staff based on feelings; staff based on historical hourly sales.
- Consistency equals profit. Systems and standards protect your margins from human error.
Actions for Improvement
At Work:
Perform a "waste audit" for three days. Have every cook scrape prep waste into a clear bucket instead of the trash. Seeing the physical volume of lost profit is a wake-up call for the team.
At Home:
Review your last three months of P&L statements. Calculate your Prime Cost for each month. If it is rising while sales stay flat, you have an operational leak.
In the Community:
Support local businesses that prioritize quality and sustainability. Share your success stories with other operators: hospitality is a community, and rising tides lift all boats.
In Civic Life:
Stay informed on local labor laws and minimum wage adjustments in cities like Oakland and San Francisco, as these directly impact your labor cost targets.
The Extra Step:
Contact an expert for a Financial Assessment. Often, an outside set of eyes can see the 2% or 3% "leak" that you've grown accustomed to seeing every day.
FAQ
Q: What is a "good" profit margin for a new restaurant?
A: In the first year, breaking even is often considered a win. However, once stabilized, you should be targeting a minimum of 8% to 10% net profit.
Q: Why are restaurant margins so much lower than other industries?
A: Restaurants are "triple-threat" businesses: they are manufacturers (the kitchen), retailers (the dining room), and service providers. This complexity creates multiple points of failure for profit.
Q: Does raising prices hurt my margins?
A: Not if done strategically. Small, incremental increases (3-5%) on popular items are often unnoticed by guests but can significantly boost the bottom line.
Q: Is delivery actually profitable?
A: Only if you price it specifically for the platform. Third-party commissions (20-30%) can easily wipe out your entire net profit if you use your in-house menu pricing.
Q: What is the most important number to track daily?
A: Sales vs. Labor hours. Knowing your labor percentage in real-time allows you to cut staff early if the floor is slow.
Where Smart Strategy Meets Profitable Hospitality.
At McFadden Finch Restaurant Consulting Group, we help restaurant owners make sharper decisions, strengthen operations, and build businesses designed to perform. From feasibility studies and concept development to menu strategy and long-term operational consulting, we help your restaurant move beyond survival and into sustained growth.
McFadden Finch Restaurant Consulting Group
Lake Merritt Plaza
1999 Harrison St., 18th Floor
Oakland, CA 94612
(510) 973-2410
www.mcfadden-finch-group.com
executive.team@mcfadden-finch-group.com
Schedule your discovery call today and start building a stronger, smarter, more profitable restaurant. The corporate office address and email are listed on McFadden Finch Holdings’ contact page, and MFRCG is included in the company’s hospitality consulting portfolio.
Sources
[1] National Restaurant Association, "2024 State of the Restaurant Industry," February 2024, https://restaurant.org, Accessed May 13, 2026.
[2] Restaurant365, "The 2024 Restaurant Benchmark Report," March 2024, https://www.restaurant365.com, Accessed May 13, 2026.
[3] Toast, "The Average Restaurant Profit Margin in 2024," January 2024, https://pos.toasttab.com, Accessed May 13, 2026.
[4] U.S. Bureau of Labor Statistics, "Occupational Employment and Wages: Food Service Managers," May 2023, https://www.bls.gov, Accessed May 13, 2026.
[5] Forbes, "How To Manage Restaurant Occupancy Costs," June 2023, https://www.forbes.com, Accessed May 13, 2026.
[6] UNFI, "Solutions for Independent Restaurants," 2024, https://www.unfi.com, Accessed May 13, 2026.
[7] Cornell University Center for Hospitality Research, "The Impact of Portion Control on Profitability," 2022, https://sha.cornell.edu, Accessed May 13, 2026.
[8] Restaurant Business Online, "Mastering the Labor Schedule," April 2024, https://www.restaurantbusinessonline.com, Accessed May 13, 2026.
[9] Lightspeed HQ, "2024 Global State of the Hospitality Industry," January 2024, https://www.lightspeedhq.com, Accessed May 13, 2026.
[10] DoorDash, "Restaurant Online Ordering Trends 2024," 2024, https://get.doordash.com, Accessed May 13, 2026.
[11] McFadden Finch Restaurant Consulting Group, "Internal Financial Assessment Framework," 2025.
[12] Menu Cover Depot, "The Psychology of Menu Engineering," 2023, https://www.menucoverdepot.com, Accessed May 13, 2026.
[13] Square for Restaurants, "The Role of POS in Inventory Management," 2024, https://squareup.com, Accessed May 13, 2026.
[14] Caterease, "Boosting Margins Through Catering Operations," 2023, https://www.caterease.com, Accessed May 13, 2026.
Disclaimer: This content is for general informational purposes only and does not constitute legal, financial, tax, operational, employment, regulatory, or other professional advice. Reading this content does not create a client, consulting, or contractual relationship with McFadden Finch Restaurant Consulting Group. Because every restaurant, market, and business situation is different, you should consult qualified professionals regarding your specific circumstances. McFadden Finch Restaurant Consulting Group makes no warranties regarding the accuracy or completeness of this information and is not responsible for third-party content, links, products, or services referenced. Testimonials, examples, case studies, and projected outcomes are illustrative only and do not guarantee similar results.