Labor is no longer a variable cost you can simply manage with a sharper pencil. In 2026, it is a structural challenge that requires a systemic solution. According to the TouchBistro 2026 State of Restaurants Report, 96% of operators are spending more on labor than they were just twelve months ago, with more than half reporting increases between 21% and 50% [1]. This is not a temporary spike. It is the reality of a market where the average cost to train a new employee has climbed to $3,037, while average tenure has dipped to roughly 110 days [1].
When you look at your Profit and Loss statement and see labor creeping toward 40% of sales, the instinct is often to cut hours. But cutting hours without changing the work usually leads to slower ticket times, burnt-out staff, and guest dissatisfaction. The answer lies in treating the kitchen not as a collection of people and stoves, but as a manufacturing system where layout, scheduling, and training are three gears that must mesh perfectly to drive efficiency.
In this post, we will examine how to:
- Design a kitchen layout that minimizes wasted motion and maximizes throughput.
- Use data-forecasting tools to build schedules that match real-time demand.
- Implement cross-training programs that provide operational flexibility and reduce turnover.
The Physics of Profit: Layout as the Foundation
Efficiency starts with the floor plan. Every step a cook takes is a second of labor you are paying for. If a line cook has to walk twelve feet to reach a reach-in cooler for every order, those steps add up to miles over a week. Data from Piedmont Avenue Consulting suggests that optimizing the "work triangle" in a commercial kitchen can reduce labor requirements by as much as 15% during peak hours [3].
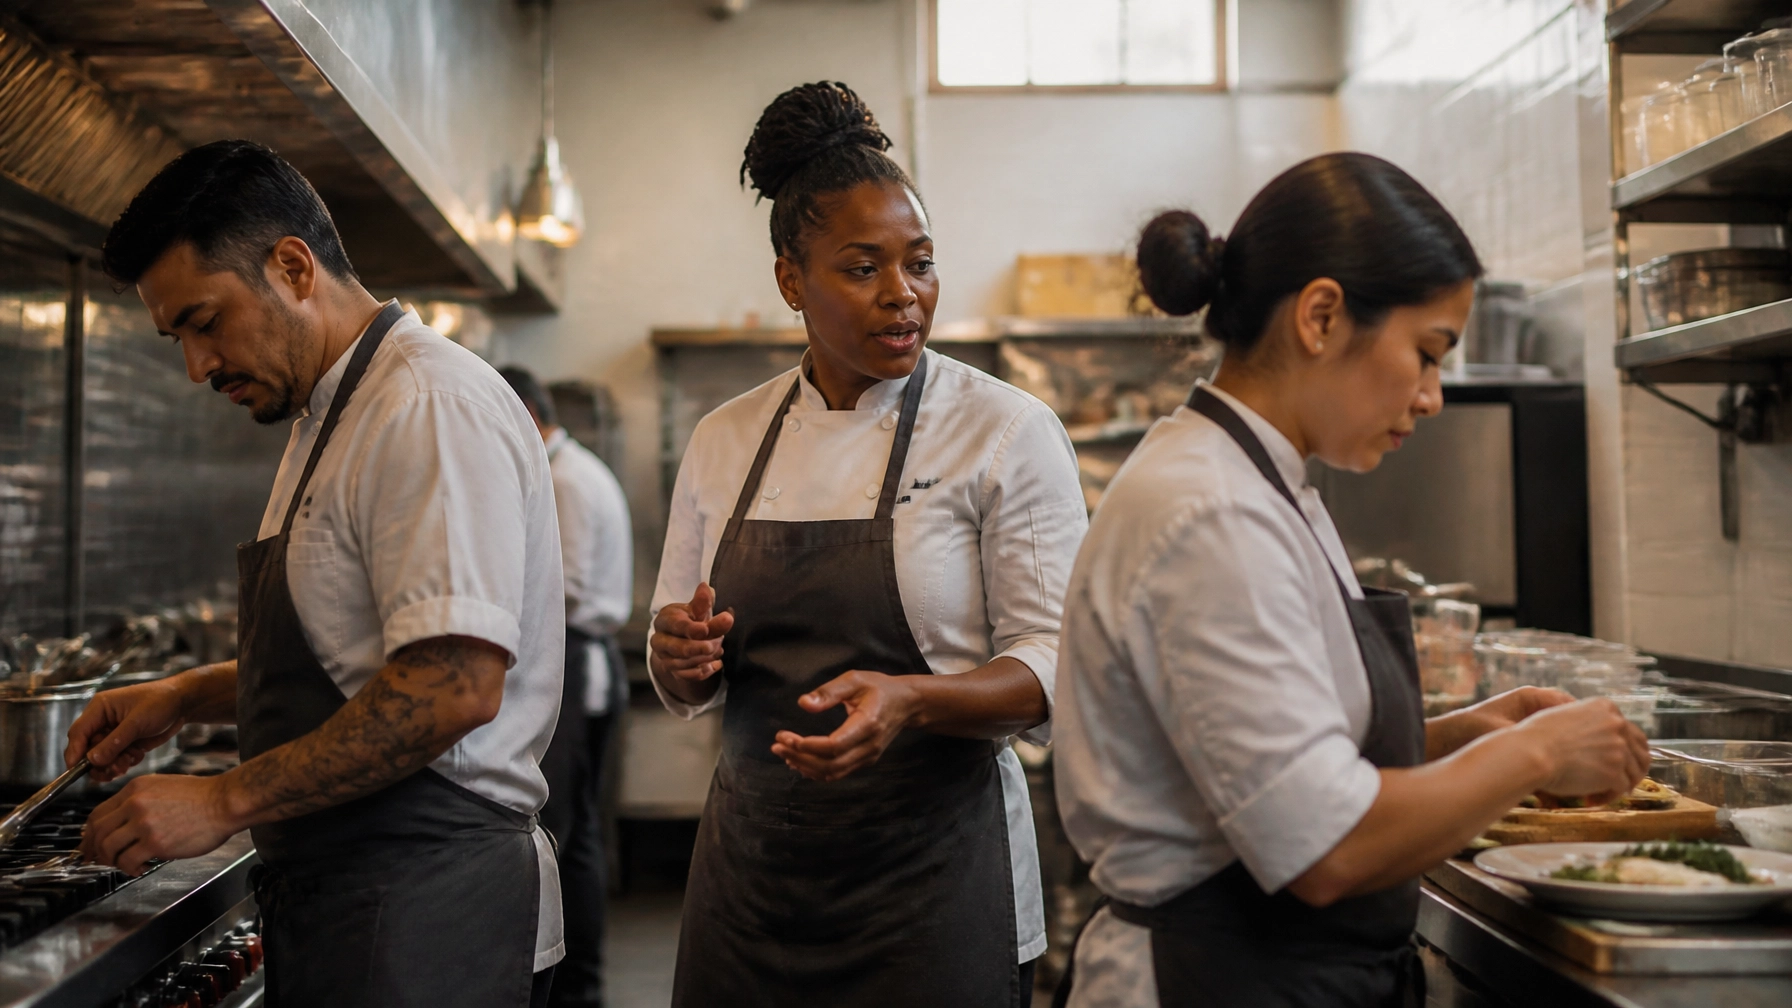
A systematic layout prioritizes the "golden circle" of the cook. Everything required for the 80% of most popular dishes should be within a three-foot radius of the station. This means refrigerated drawers under the grill, spices at eye level, and plateware exactly where the final garnish happens. When the physical space is designed to support the menu, the staff can produce more food with less physical strain.
Mapping the Prep: Minimizing Motion
Beyond the line, the prep area is where labor often disappears into thin air. Many kitchens suffer from a layout that forces staff to cross paths or backtrack. Using benchmarks from Fortune Kitchenware, efficient kitchens are now moving toward "flow-through" prep designs where raw ingredients enter one side and finished components exit toward the line without ever doubling back [6].
Think of your kitchen layout as an assembly line. If your prep cook spends 20% of their shift moving boxes or searching for equipment, you are effectively paying a 20% tax on your labor. By organizing smallwares and prep stations based on frequency of use, you turn motion into production. This structural efficiency allows a smaller team to handle higher volumes without feeling the crush of a busy shift.

The Math of the Rush: Data-Driven Scheduling
The era of the "standard" schedule is over. In 2026, best-in-class operators are moving away from fixed templates and toward demand-based forecasting. Tools like Tableview use historical sales data, local events, and even weather patterns to predict exactly when the rush will hit [4].
The goal is to move from "staffing for the shift" to "staffing for the hour." The TouchBistro report notes that the average restaurant is short five staff members, making every scheduled hour precious [1]. By scheduling 10% below your estimated need and filling the gaps with highly trained "floaters," you protect your margins during slow periods while maintaining the ability to scale up when the dining room fills. Scheduling is no longer an administrative task; it is a financial strategy.
Cross-Training: Your Operational Insurance Policy
If your grill cook calls out and no one else knows how to work that station, your system breaks. Cross-training is the ultimate defense against the high turnover rates of the modern industry. 7shifts research indicates that restaurants with robust cross-training programs see higher employee engagement and lower turnover [5].
When a server knows how to run expo, or a dishwasher is trained on basic prep, you create a flexible workforce. This flexibility allows you to run leaner crews because you are not hiring for specific roles, but for a set of skills that can be deployed where they are needed most. A team that can pivot between stations is more resilient, more productive, and ultimately more profitable.

Integrated Metrics: Beyond the P&L
To manage labor effectively, you need more than a monthly look at your labor percentage. Real-time metrics provided by platforms like Katalyst allow operators to track "profit per labor hour" [7]. This metric tells you more than just what you spent; it tells you what you earned for every hour a staff member was on the clock.
In 2026, a healthy labor cost is generally considered to be between 25% and 35% of sales, depending on the service model [2]. If your prime cost, the combination of food and labor, is consistently over 60%, the system is failing somewhere. By tracking labor hours per 100 covers, you can see exactly where the inefficiencies lie. Is the prep taking too long? Is the line overstaffed during the shoulder hours? The data provides the answer.
The Implementation Timeline
Transitioning to a systematic approach does not happen overnight. It requires a phased rollout to ensure the team buys into the new way of working.
- Month 1: Conduct a motion study. Observe the team during a rush and map out where people are walking unnecessarily.
- Month 2: Review equipment layout. Move high-use items into the "golden circle" of each station.
- Month 3: Integrate scheduling software with your POS. Begin building schedules based on 6-week rolling sales averages.
- Month 4: Launch the cross-training program. Identify "swing" players who can be trained on a secondary station.
- Month 5: Audit the menu. Remove high-labor, low-margin items that clog the system.
- Month 6: Review the numbers. Compare labor as a percentage of sales and profit per labor hour against your pre-system benchmarks.
2026 Labor Efficiency Benchmarks
The following table reflects current industry standards for high-performing restaurants in the Bay Area and beyond, based on 2026 reporting data.
| Metric | Industry Average | Best-in-Class Target | Source |
|---|---|---|---|
| Labor Cost % of Sales | 30% to 40% | 25% to 30% | Katalyst [7] |
| Prime Cost % | 65% to 70% | Under 60% | Restaurant.org [2] |
| Training Cost per Employee | $3,037 | Under $2,200 | TouchBistro [1] |
| Avg. Employee Tenure | 110 Days | Over 200 Days | 7shifts [5] |
| Profit per Labor Hour | Varies | $45+ (Full Service) | Katalyst [7] |
Case Example: The Turnaround of a Mid-Scale Grill
An independent grill in the East Bay was struggling with labor costs that had spiked to 42% following a minimum wage increase. The owners initially tried cutting two servers and a line cook, but ticket times soared to 45 minutes, and online reviews plummeted.
The Executive Team at McFadden Finch Restaurant Consulting Group stepped in to reorganize the kitchen as a system. First, we redesigned the line layout, installing refrigerated drawers and a custom spice rack that saved the lead cook an estimated 400 steps per shift. Next, we implemented a cross-training program where the host was trained to support the expo station during peak rushes. Finally, we moved scheduling to a data-driven model that cut four hours of "dead time" from the morning prep shift. Within four months, labor costs stabilized at 31%, and employee morale improved because the shifts were no longer chaotic.
What Smart Critics Argue
Some operators argue that turning a kitchen into a "system" strips away the craft and soul of cooking. They worry that a focus on efficiency leads to a "fast food" mentality that guests will notice.
While this concern is understandable, the reality is the opposite. A well-designed system removes the "noise", the searching for pans, the running for towels, the confusion over schedules, so that the chefs can actually focus on the food. Efficiency is not the enemy of quality; it is the infrastructure that makes quality possible at a sustainable price point. In 2026, if you do not have the margin, you do not have the ability to buy the high-quality ingredients that define your craft.

Key Takeaways
- Layout is Destiny: Your floor plan dictates your labor costs. If the kitchen is hard to work in, it will be expensive to run.
- Steps are Dollars: Every unnecessary movement by a staff member is a drain on your margin.
- Data Over Intuition: Use forecasting tools to build schedules. Do not rely on how it "usually" feels on a Tuesday.
- Training is Retention: Employees who are cross-trained feel more valuable and are less likely to leave for a nominal wage increase elsewhere.
- Monitor Prime Cost: Food and labor must be managed together. A low labor cost is meaningless if your food waste is out of control.
Actions to Take Now
At Work
Audit your kitchen line during a Friday night rush. Carry a notepad and count how many times a cook has to leave their station. Identify the three most common reasons and move those items within reach by Monday.
In the Community
Connect with other local operators to discuss wage benchmarks and hiring trends. Understanding the local labor landscape helps you position your restaurant as an employer of choice.
In Civic Life
Stay informed on local labor ordinances and minimum wage adjustments. Proactive planning for regulatory changes is easier than reactive scrambling.
At Home
Review your personal management style. Systems work best when the leadership is consistent and supportive.
In Your Digital Stack
Review your POS integration. If your scheduling tool is not talking to your sales data, you are missing the most important part of the puzzle.
One Extra Step
Identify your top-performing employee and ask them what the most frustrating part of their physical workspace is. They are the ones living the system every day and usually have the best ideas for fixing it.
Frequently Asked Questions
Does a better layout really reduce headcount?
It often does not reduce the number of people you need on the roster, but it reduces the number of hours those people need to work to achieve the same result. It allows you to produce more covers with the same staff.
Is scheduling software worth the cost for a small restaurant?
Yes. If the software saves you just three hours of overstaffing a week, it pays for itself in less than a month. The visibility it provides is priceless.
How do I get my cooks to buy into cross-training?
Frame it as professional development. A cook who knows five stations is more employable and more valuable to the team than a cook who only knows one.
What is the most common layout mistake?
Placing high-volume prep items or equipment in a corner or a "dead zone" where staff have to cross each other's paths to get there.
How often should I review my labor metrics?
Daily. You should know your labor percentage for every shift before you go home. Weekly and monthly reviews are for strategy, but daily checks are for control.
Where Smart Strategy Meets Profitable Hospitality.
At McFadden Finch Restaurant Consulting Group, we help restaurant owners make sharper decisions, strengthen operations, and build businesses designed to perform. From feasibility studies and concept development to menu strategy and long-term operational consulting, we help your restaurant move beyond survival and into sustained growth.
McFadden Finch Restaurant Consulting Group
Lake Merritt Plaza
1999 Harrison St., 18th Floor
Oakland, CA 94612
(510) 973-2410
www.mcfadden-finch-group.com
executive.team@mcfadden-finch-group.com
Schedule your discovery call today and start building a stronger, smarter, more profitable restaurant. The corporate office address and email are listed on McFadden Finch Holdings' contact page, and MFRCG is included in the company's hospitality consulting portfolio.
Sources
[1] TouchBistro, "2026 State of Restaurants Report," January 2026, https://www.touchbistro.com/wp-content/uploads/2026/01/TouchBistro-2026-American-State-of-Restaurants-Report.pdf, Accessed July 15, 2026.
[2] National Restaurant Association, "State of the Restaurant Industry 2026," February 2026, https://restaurant.org/research-and-media/research/research-reports/state-of-the-industry/, Accessed July 15, 2026.
[3] Piedmont Avenue Consulting, "Restaurant Kitchen Design for Operational Efficiency," May 2026, https://piedmontave.com/restaurant-kitchen-design-for-operational-efficiency/, Accessed July 15, 2026.
[4] Tableview, "Restaurant Staff Scheduling: The 2026 Manager's Playbook," May 2026, https://www.tableview.com/blog/restaurant-staff-scheduling/, Accessed July 15, 2026.
[5] 7shifts, "How to Successfully Cross-Train Your Restaurant Team in 2026," June 2026, https://www.7shifts.com/blog/cross-train-restaurant-team/, Accessed July 15, 2026.
[6] Fortune Kitchenware, "Restaurant Kitchen Efficiency Benchmarks Worth Tracking in 2026," April 2026, https://www.fortune-kitchenware.com/news/market-insights/industry-reports/Restaurant_Kitchen_Efficiency_Benchmarks_Worth_Tracking_in_2026.html, Accessed July 15, 2026.
[7] Katalyst, "Restaurant Labor Cost Percentage: How to Calculate It and How to Actually Bring It Down," June 2026, https://www.katalystos.com/blog/how-to-calculate-and-reduce-restaurant-labor-cost, Accessed July 15, 2026.
Disclaimer: This content is for general informational purposes only and does not constitute legal, financial, tax, operational, employment, regulatory, or other professional advice. Reading this content does not create a client, consulting, or contractual relationship with McFadden Finch Restaurant Consulting Group. Because every restaurant, market, and business situation is different, you should consult qualified professionals regarding your specific circumstances. McFadden Finch Restaurant Consulting Group makes no warranties regarding the accuracy or completeness of this information and is not responsible for third-party content, links, products, or services referenced. Testimonials, examples, case studies, and projected outcomes are illustrative only and do not guarantee similar results.